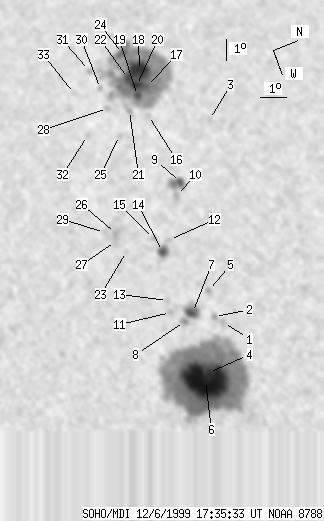
SOHO MDI 1999-12-06 17:35:33 UT
| group | Proj. U | Proj. WS | Corr. U | Corr. WS | B | L | LCM | Pos. angle | r | MU | MP |
| 222 | 1433 | 131 | 848 | 10.19 | 309.79 | -31.29 | 70.63 | 0.5388 | 689.6 | 103.3 | |
|
previous
or next observation for the same group /
back to the solar disc SOHO MDI 1999-12-06 17:35:33 UT |
| spot | Proj. U | Proj. WS | Corr. U | Corr. WS | B | L | LCM | Pos. angle | r | MU | MP |
| 0 | 6 | 0 | 3 | 10.95 | 313.76 | -27.31 | 67.36 | 0.4901 | -540.0 | -389.1 | |
| 0 | 5 | 0 | 3 | 10.71 | 313.40 | -27.67 | 68.08 | 0.4940 | 450.0 | 480.3 | |
| 0 | 5 | 0 | 3 | 13.27 | 304.45 | -36.63 | 68.60 | 0.6260 | -770.0 | -588.6 | |
| 7 | 789 | 4 | 437 | 9.72 | 315.67 | -25.40 | 68.50 | 0.4564 | 1449.9 | 643.5 | |
| 0 | 4 | 0 | 2 | 10.85 | 312.22 | -28.86 | 68.56 | 0.5114 | -753.0 | -531.1 | |
| 124 | -4 | 69 | -4 | 9.50 | 315.97 | -25.11 | 68.75 | 0.4510 | 2085.7 | 999999 | |
| 11 | 25 | 6 | 15 | 9.96 | 312.96 | -28.11 | 69.79 | 0.4966 | 999.1 | 605.7 | |
| 0 | 6 | 0 | 3 | 9.55 | 313.25 | -27.83 | 70.42 | 0.4907 | 1082.0 | 875.1 | |
| 5 | 29 | 3 | 18 | 11.33 | 307.08 | -33.99 | 70.47 | 0.5839 | -1038.8 | -682.3 | |
| 0 | 8 | 0 | 5 | 11.00 | 307.63 | -33.45 | 70.76 | 0.5753 | -642.0 | -567.2 | |
| 0 | 4 | 0 | 2 | 9.17 | 312.69 | -28.39 | 71.49 | 0.4970 | 907.0 | 770.2 | |
| 0 | 6 | 0 | 4 | 10.14 | 309.52 | -31.56 | 71.34 | 0.5459 | 413.0 | 344.5 | |
| 0 | 4 | 0 | 3 | 9.22 | 312.14 | -28.93 | 71.68 | 0.5051 | 577.0 | 537.8 | |
| 8 | 18 | 5 | 10 | 9.72 | 309.96 | -31.12 | 71.88 | 0.5381 | 1006.2 | 700.0 | |
| 0 | 4 | 0 | 2 | 9.57 | 309.28 | -31.80 | 72.46 | 0.5471 | 477.0 | 422.1 | |
| 0 | 5 | 0 | 3 | 11.09 | 303.55 | -37.52 | 72.33 | 0.6297 | -593.0 | -509.3 | |
| 5 | 459 | 3 | 301 | 11.42 | 302.11 | -38.96 | 72.35 | 0.6492 | -1382.3 | -614.5 | |
| 33 | -17 | 22 | -17 | 11.39 | 301.24 | -39.84 | 72.71 | 0.6601 | -1219.2 | 999999 | |
| 5 | -17 | 3 | -17 | 10.97 | 302.45 | -38.63 | 72.92 | 0.6435 | -1595.3 | 999999 | |
| 8 | -17 | 5 | -17 | 11.07 | 301.94 | -39.13 | 72.94 | 0.6502 | -1712.2 | 999999 | |
| 0 | 5 | 0 | 3 | 10.47 | 303.08 | -38.00 | 73.46 | 0.6338 | -1030.0 | -759.0 | |
| 8 | -17 | 5 | -17 | 10.87 | 301.50 | -39.57 | 73.38 | 0.6553 | -1320.7 | 999999 | |
| 0 | 3 | 0 | 2 | 8.41 | 309.50 | -31.57 | 74.44 | 0.5398 | 813.0 | 680.9 | |
| 8 | -17 | 6 | -17 | 11.00 | 300.17 | -40.90 | 73.61 | 0.6723 | 122.9 | 999999 | |
| 0 | 5 | 0 | 3 | 9.76 | 304.15 | -36.93 | 74.20 | 0.6177 | -849.0 | -729.0 | |
| 0 | 9 | 0 | 5 | 8.26 | 308.57 | -32.51 | 75.08 | 0.5525 | 883.0 | 756.6 | |
| 0 | 10 | 0 | 6 | 8.15 | 308.92 | -32.15 | 75.14 | 0.5472 | 576.0 | 618.5 | |
| 0 | 4 | 0 | 3 | 9.70 | 302.71 | -38.37 | 74.78 | 0.6365 | -1017.0 | -867.0 | |
| 0 | 3 | 0 | 2 | 7.88 | 308.38 | -32.69 | 75.83 | 0.5540 | 594.0 | 533.7 | |
| 0 | 5 | 0 | 3 | 9.72 | 301.64 | -39.43 | 75.07 | 0.6503 | -625.0 | -502.4 | |
| 0 | 5 | 0 | 3 | 9.57 | 300.61 | -40.46 | 75.60 | 0.6631 | -561.0 | -442.1 | |
| 0 | 4 | 0 | 2 | 8.60 | 303.73 | -37.34 | 76.18 | 0.6200 | -782.0 | -554.8 | |
| 0 | 3 | 0 | 2 | 8.71 | 301.55 | -39.53 | 76.63 | 0.6490 | -537.0 | -535.3 | |
| Proj. U | - Projected umbra area in millionths of solar disc, negative values indicate | |
|
that the umbra consists of fragmented regions which cannot be separated without losing umbral area. In this way several spots (intensity minima in the umbra) have a common umbra, e.g. -2 means that the given spot shares an umbra with spot No.2, and the common U value is indicated at spot No.2. |
||
| Proj. WS | - Projected whole spot area in millionths of solar disc, negative values indicate | |
|
that several umbras have a common penumbra, e.g. -7 means that the given umbra shares a penumbra with umbra No.7, and the WS value is indicated at No.7. |
||
| Corr. U | - Corrected umbra area in millionths of solar hemisphere, for negative values see above | |
| Corr. WS | - Corrected whole spot area in millionths of solar hemisphere, for negative values see above | |
| B | - Heliographic latitude B; positive: North, negative: South | |
| L | - Heliographic longitude L | |
| LCM | - Longitudinal distance from the Sun's central meridian | |
| Pos. angle | - Position angle | |
| r | - Distance from the centre of Sun's disc in terms of Sun's radius | |
| MU | - Mean magnetic field within the umbra contour averaged the pixel values with sign. | |
| MP | - Mean magnetic field within the penumbra contour averaged the pixel values with sign. | |