SOHO MDI 1999-12-06 20:47:33 UT
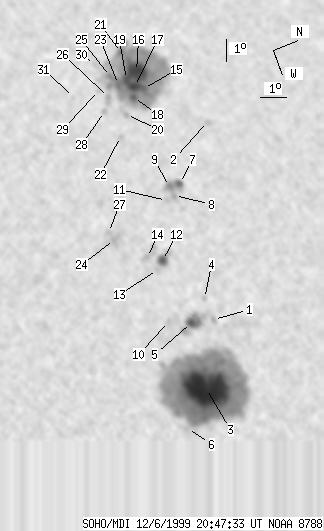
| group | Proj. U | Proj. WS | Corr. U | Corr. WS | B | L | LCM | Pos. angle | r | MU | MP |
| 249 | 1452 | 144 | 848 | 10.15 | 309.82 | -29.50 | 69.61 | 0.5141 | 664.6 | 122.2 | |
|
previous
or next observation for the same group /
back to the solar disc SOHO MDI 1999-12-06 20:47:33 UT |
| spot | Proj. U | Proj. WS | Corr. U | Corr. WS | B | L | LCM | Pos. angle | r | MU | MP |
| 0 | 5 | 0 | 3 | 10.73 | 313.25 | -26.07 | 66.89 | 0.4714 | 597.0 | 397.9 | |
| 0 | 5 | 0 | 3 | 13.27 | 304.42 | -34.90 | 67.76 | 0.6040 | -684.0 | -593.4 | |
| 151 | 785 | 82 | 429 | 9.52 | 316.01 | -23.31 | 67.28 | 0.4250 | 2055.8 | 648.0 | |
| 0 | 3 | 0 | 2 | 10.69 | 312.26 | -27.06 | 67.66 | 0.4853 | -676.0 | -448.6 | |
| 5 | 48 | 3 | 27 | 9.89 | 313.11 | -26.21 | 68.68 | 0.4690 | 1278.0 | 590.5 | |
| 0 | 3 | 0 | 2 | 8.28 | 317.37 | -21.95 | 68.99 | 0.3980 | 281.0 | 166.1 | |
| 6 | 24 | 3 | 15 | 11.38 | 306.95 | -32.37 | 69.57 | 0.5622 | -807.9 | -744.5 | |
| 0 | 4 | 0 | 3 | 11.03 | 307.43 | -31.89 | 69.92 | 0.5542 | -811.0 | -724.2 | |
| 3 | -7 | 2 | -7 | 10.97 | 306.97 | -32.35 | 70.26 | 0.5603 | -796.3 | 999999 | |
| 0 | 5 | 0 | 3 | 9.07 | 312.78 | -26.54 | 70.56 | 0.4699 | 867.0 | 714.7 | |
| 0 | 4 | 0 | 3 | 10.67 | 307.56 | -31.76 | 70.49 | 0.5510 | -653.0 | -568.3 | |
| 8 | 20 | 5 | 11 | 9.69 | 310.13 | -29.19 | 70.90 | 0.5108 | 952.4 | 601.0 | |
| 0 | 4 | 0 | 2 | 9.39 | 310.45 | -28.87 | 71.30 | 0.5049 | 831.0 | 884.1 | |
| 0 | 21 | 0 | 12 | 9.19 | 309.81 | -29.51 | 72.01 | 0.5133 | 633.0 | 440.9 | |
| 5 | 465 | 3 | 297 | 11.38 | 302.11 | -37.21 | 71.73 | 0.6266 | -1367.8 | -580.1 | |
| 35 | -15 | 23 | -15 | 11.36 | 301.21 | -38.11 | 72.11 | 0.6382 | -1263.3 | 999999 | |
| 9 | -15 | 6 | -15 | 11.08 | 301.91 | -37.41 | 72.28 | 0.6282 | -1710.8 | 999999 | |
| 5 | -15 | 3 | -15 | 10.89 | 302.42 | -36.90 | 72.38 | 0.6209 | -1576.2 | 999999 | |
| 8 | -15 | 5 | -15 | 10.89 | 301.48 | -37.84 | 72.74 | 0.6332 | -1393.6 | 999999 | |
| 0 | 10 | 0 | 6 | 10.40 | 303.14 | -36.18 | 72.88 | 0.6098 | -874.0 | -785.9 | |
| 4 | -15 | 3 | -15 | 11.08 | 300.10 | -39.22 | 72.93 | 0.6515 | 124.3 | 999999 | |
| 0 | 4 | 0 | 2 | 9.88 | 304.09 | -35.23 | 73.36 | 0.5954 | -838.0 | -695.4 | |
| 8 | -15 | 5 | -15 | 10.53 | 301.62 | -37.70 | 73.24 | 0.6302 | -1364.5 | 999999 | |
| 0 | 8 | 0 | 5 | 8.25 | 308.62 | -30.70 | 74.35 | 0.5269 | 909.0 | 818.6 | |
| 2 | -15 | 1 | -15 | 10.35 | 301.13 | -38.19 | 73.69 | 0.6360 | -974.4 | 999999 | |
| 0 | 10 | 0 | 7 | 9.98 | 302.12 | -37.20 | 73.92 | 0.6221 | -1165.0 | -883.1 | |
| 0 | 6 | 0 | 4 | 8.12 | 308.24 | -31.08 | 74.73 | 0.5319 | 676.0 | 529.1 | |
| 0 | 4 | 0 | 3 | 9.65 | 302.73 | -36.59 | 74.24 | 0.6130 | -1003.0 | -894.5 | |
| 0 | 3 | 0 | 2 | 9.72 | 301.66 | -37.66 | 74.49 | 0.6274 | -409.0 | -501.0 | |
| 0 | 9 | 0 | 6 | 9.93 | 300.35 | -38.97 | 74.58 | 0.6450 | -28.0 | -128.9 | |
| 0 | 2 | 0 | 1 | 8.72 | 301.67 | -37.65 | 76.06 | 0.6245 | -596.0 | -537.2 | |
| Proj. U | - Projected umbra area in millionths of solar disc, negative values indicate | |
|
that the umbra consists of fragmented regions which cannot be separated without losing umbral area. In this way several spots (intensity minima in the umbra) have a common umbra, e.g. -2 means that the given spot shares an umbra with spot No.2, and the common U value is indicated at spot No.2. |
||
| Proj. WS | - Projected whole spot area in millionths of solar disc, negative values indicate | |
|
that several umbras have a common penumbra, e.g. -7 means that the given umbra shares a penumbra with umbra No.7, and the WS value is indicated at No.7. |
||
| Corr. U | - Corrected umbra area in millionths of solar hemisphere, for negative values see above | |
| Corr. WS | - Corrected whole spot area in millionths of solar hemisphere, for negative values see above | |
| B | - Heliographic latitude B; positive: North, negative: South | |
| L | - Heliographic longitude L | |
| LCM | - Longitudinal distance from the Sun's central meridian | |
| Pos. angle | - Position angle | |
| r | - Distance from the centre of Sun's disc in terms of Sun's radius | |
| MU | - Mean magnetic field within the umbra contour averaged the pixel values with sign. | |
| MP | - Mean magnetic field within the penumbra contour averaged the pixel values with sign. | |