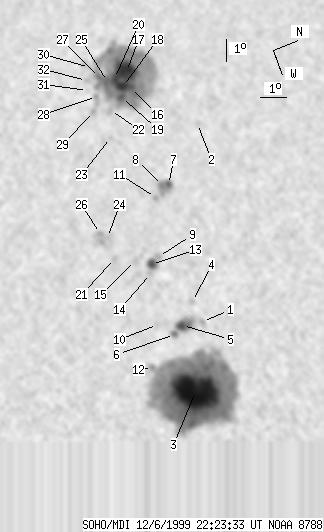
SOHO MDI 1999-12-06 22:23:33 UT
| group | Proj. U | Proj. WS | Corr. U | Corr. WS | B | L | LCM | Pos. angle | r | MU | MP |
| 219 | 1406 | 126 | 812 | 10.13 | 309.88 | -28.56 | 69.05 | 0.5010 | 689.6 | 163.9 | |
|
previous
or next observation for the same group /
back to the solar disc SOHO MDI 1999-12-06 22:23:33 UT |
| spot | Proj. U | Proj. WS | Corr. U | Corr. WS | B | L | LCM | Pos. angle | r | MU | MP |
| 0 | 6 | 0 | 3 | 10.71 | 313.25 | -25.19 | 66.24 | 0.4588 | 378.0 | 366.9 | |
| 0 | 4 | 0 | 3 | 13.29 | 304.52 | -33.92 | 67.21 | 0.5914 | -729.0 | -554.7 | |
| 131 | 750 | 71 | 407 | 9.49 | 316.02 | -22.42 | 66.57 | 0.4117 | 2112.9 | 732.5 | |
| 0 | 4 | 0 | 2 | 10.63 | 312.30 | -26.14 | 67.14 | 0.4720 | -358.0 | -394.7 | |
| 9 | 44 | 5 | 24 | 9.93 | 313.17 | -25.27 | 67.91 | 0.4557 | 1115.0 | 548.9 | |
| 2 | -5 | 1 | -5 | 9.52 | 313.45 | -24.99 | 68.58 | 0.4496 | 1007.3 | 999999 | |
| 4 | 28 | 2 | 17 | 11.37 | 306.97 | -31.47 | 69.09 | 0.5501 | -920.1 | -835.6 | |
| 2 | -7 | 1 | -7 | 11.14 | 306.94 | -31.50 | 69.51 | 0.5495 | -1105.1 | 999999 | |
| 0 | 6 | 0 | 4 | 10.01 | 309.98 | -28.46 | 69.86 | 0.5019 | 462.0 | 423.1 | |
| 0 | 4 | 0 | 2 | 9.04 | 312.82 | -25.62 | 70.01 | 0.4563 | 940.0 | 752.0 | |
| 0 | 5 | 0 | 3 | 10.72 | 307.39 | -31.05 | 70.01 | 0.5415 | -608.0 | -468.1 | |
| 0 | 8 | 0 | 5 | 8.27 | 314.51 | -23.93 | 70.52 | 0.4276 | 633.0 | 446.6 | |
| 7 | 15 | 4 | 9 | 9.65 | 310.24 | -28.20 | 70.41 | 0.4966 | 997.7 | 704.1 | |
| 0 | 3 | 0 | 2 | 9.49 | 310.61 | -27.83 | 70.50 | 0.4906 | 830.0 | 790.0 | |
| 0 | 13 | 0 | 7 | 9.12 | 309.87 | -28.57 | 71.63 | 0.4997 | 614.0 | 535.5 | |
| 4 | 449 | 3 | 284 | 11.37 | 302.07 | -36.37 | 71.40 | 0.6157 | -1371.5 | -586.0 | |
| 34 | -16 | 22 | -16 | 11.41 | 301.25 | -37.19 | 71.67 | 0.6265 | -1218.1 | 999999 | |
| 9 | -16 | 6 | -16 | 11.06 | 301.92 | -36.52 | 71.96 | 0.6166 | -1795.5 | 999999 | |
| 5 | -16 | 3 | -16 | 10.87 | 302.43 | -36.01 | 72.06 | 0.6093 | -1572.9 | 999999 | |
| 6 | -16 | 4 | -16 | 10.88 | 301.44 | -37.00 | 72.43 | 0.6222 | -1376.3 | 999999 | |
| 0 | 5 | 0 | 3 | 8.39 | 309.52 | -28.92 | 73.23 | 0.5018 | 732.0 | 698.5 | |
| 0 | 7 | 0 | 4 | 10.29 | 302.90 | -35.54 | 72.80 | 0.6010 | -862.0 | -717.5 | |
| 0 | 3 | 0 | 2 | 9.92 | 304.15 | -34.30 | 72.92 | 0.5829 | -740.0 | -670.5 | |
| 0 | 4 | 0 | 2 | 8.43 | 308.53 | -29.91 | 73.64 | 0.5162 | 676.0 | 550.3 | |
| 4 | -16 | 3 | -16 | 10.58 | 301.50 | -36.94 | 72.87 | 0.6205 | -1303.1 | 999999 | |
| 0 | 24 | 0 | 14 | 8.23 | 308.27 | -30.17 | 74.13 | 0.5193 | 716.0 | 728.1 | |
| 2 | -16 | 1 | -16 | 10.35 | 301.21 | -37.23 | 73.35 | 0.6236 | -1021.8 | 999999 | |
| 0 | 11 | 0 | 7 | 9.97 | 302.07 | -36.37 | 73.63 | 0.6110 | -966.0 | -853.3 | |
| 0 | 5 | 0 | 3 | 9.66 | 302.74 | -35.71 | 73.89 | 0.6012 | -1005.0 | -803.5 | |
| 0 | 2 | 0 | 1 | 10.12 | 300.61 | -37.83 | 73.91 | 0.6308 | -354.0 | -373.4 | |
| 0 | 2 | 0 | 1 | 9.73 | 301.68 | -36.77 | 74.16 | 0.6155 | -547.0 | -477.2 | |
| 0 | 4 | 0 | 3 | 9.83 | 301.19 | -37.25 | 74.16 | 0.6223 | -622.0 | -589.5 | |
| Proj. U | - Projected umbra area in millionths of solar disc, negative values indicate | |
|
that the umbra consists of fragmented regions which cannot be separated without losing umbral area. In this way several spots (intensity minima in the umbra) have a common umbra, e.g. -2 means that the given spot shares an umbra with spot No.2, and the common U value is indicated at spot No.2. |
||
| Proj. WS | - Projected whole spot area in millionths of solar disc, negative values indicate | |
|
that several umbras have a common penumbra, e.g. -7 means that the given umbra shares a penumbra with umbra No.7, and the WS value is indicated at No.7. |
||
| Corr. U | - Corrected umbra area in millionths of solar hemisphere, for negative values see above | |
| Corr. WS | - Corrected whole spot area in millionths of solar hemisphere, for negative values see above | |
| B | - Heliographic latitude B; positive: North, negative: South | |
| L | - Heliographic longitude L | |
| LCM | - Longitudinal distance from the Sun's central meridian | |
| Pos. angle | - Position angle | |
| r | - Distance from the centre of Sun's disc in terms of Sun's radius | |
| MU | - Mean magnetic field within the umbra contour averaged the pixel values with sign. | |
| MP | - Mean magnetic field within the penumbra contour averaged the pixel values with sign. | |