SOHO MDI 1999-12-07 13:40:03 UT
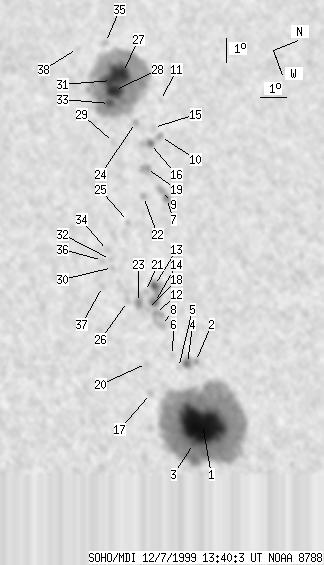
| group | Proj. U | Proj. WS | Corr. U | Corr. WS | B | L | LCM | Pos. angle | r | MU | MP |
| 220 | 1540 | 116 | 832 | 10.10 | 310.35 | -19.71 | 60.49 | 0.3765 | 833.9 | 184.6 | |
|
previous
or next observation for the same group /
back to the solar disc SOHO MDI 1999-12-07 13:40:03 UT |
| spot | Proj. U | Proj. WS | Corr. U | Corr. WS | B | L | LCM | Pos. angle | r | MU | MP |
| 138 | 839 | 71 | 434 | 9.54 | 316.24 | -13.82 | 54.97 | 0.2890 | 2145.8 | 718.6 | |
| 0 | 5 | 0 | 3 | 10.16 | 313.74 | -16.32 | 57.56 | 0.3292 | 788.0 | 535.6 | |
| 3 | -1 | 2 | -1 | 8.95 | 316.84 | -13.22 | 55.54 | 0.2752 | 2191.0 | 999999 | |
| 4 | 12 | 2 | 6 | 9.84 | 313.72 | -16.34 | 58.44 | 0.3268 | 1164.0 | 863.3 | |
| 0 | 2 | 0 | 1 | 9.46 | 313.76 | -16.30 | 59.40 | 0.3231 | 630.0 | 619.4 | |
| 0 | 5 | 0 | 2 | 9.41 | 313.22 | -16.84 | 60.32 | 0.3304 | 550.0 | 564.4 | |
| 3 | 11 | 1 | 6 | 11.37 | 306.92 | -23.13 | 62.97 | 0.4343 | -1117.6 | -717.3 | |
| 0 | 11 | 0 | 6 | 9.42 | 311.92 | -18.14 | 62.02 | 0.3493 | 1236.0 | 1112.0 | |
| 0 | 11 | 0 | 6 | 11.29 | 306.54 | -23.52 | 63.48 | 0.4393 | -1354.0 | -1024.6 | |
| 0 | 7 | 0 | 4 | 12.01 | 304.28 | -25.78 | 63.99 | 0.4753 | 244.0 | 418.5 | |
| 0 | 2 | 0 | 1 | 12.51 | 302.75 | -27.30 | 64.23 | 0.4993 | -201.0 | -243.0 | |
| 0 | 15 | 0 | 8 | 9.37 | 311.38 | -18.68 | 62.82 | 0.3568 | 1242.0 | 941.5 | |
| 5 | 42 | 3 | 23 | 9.72 | 310.27 | -19.79 | 63.24 | 0.3754 | 950.8 | 852.3 | |
| 5 | -13 | 2 | -13 | 9.49 | 310.93 | -19.12 | 63.05 | 0.3641 | 1321.7 | 999999 | |
| 0 | 6 | 0 | 4 | 11.88 | 303.82 | -26.24 | 64.61 | 0.4809 | -491.0 | -433.4 | |
| 3 | 14 | 2 | 8 | 11.55 | 304.46 | -25.60 | 64.75 | 0.4700 | 850.6 | 595.6 | |
| 0 | 6 | 0 | 3 | 8.09 | 314.39 | -15.66 | 62.34 | 0.3032 | 482.0 | 299.7 | |
| 0 | 2 | 0 | 1 | 9.14 | 311.12 | -18.94 | 63.72 | 0.3590 | 937.0 | 896.6 | |
| 0 | 13 | 0 | 7 | 11.05 | 305.45 | -24.61 | 64.93 | 0.4531 | -1190.0 | -861.9 | |
| 0 | 6 | 0 | 3 | 8.36 | 313.20 | -16.86 | 63.23 | 0.3229 | 808.0 | 632.4 | |
| 0 | 3 | 0 | 2 | 9.31 | 310.39 | -19.67 | 64.10 | 0.3709 | 591.0 | 669.1 | |
| 0 | 6 | 0 | 3 | 10.56 | 306.56 | -23.49 | 65.01 | 0.4343 | 179.0 | 255.3 | |
| 0 | 16 | 0 | 9 | 8.91 | 310.73 | -19.33 | 64.74 | 0.3631 | 1240.0 | 964.1 | |
| 0 | 6 | 0 | 4 | 11.29 | 303.40 | -26.66 | 66.07 | 0.4834 | -988.0 | -665.7 | |
| 0 | 4 | 0 | 2 | 9.67 | 307.39 | -22.67 | 66.23 | 0.4169 | 400.0 | 361.2 | |
| 0 | 5 | 0 | 3 | 8.52 | 310.55 | -19.50 | 65.91 | 0.3633 | 802.0 | 753.8 | |
| 34 | 459 | 19 | 264 | 11.52 | 301.10 | -28.95 | 67.23 | 0.5166 | -1453.8 | -736.9 | |
| 18 | -27 | 10 | -27 | 10.97 | 301.79 | -28.27 | 67.79 | 0.5044 | -1911.6 | 999999 | |
| 0 | 5 | 0 | 3 | 10.22 | 303.97 | -26.09 | 67.78 | 0.4695 | -684.0 | -684.7 | |
| 0 | 3 | 0 | 2 | 8.45 | 309.03 | -21.03 | 67.59 | 0.3857 | 745.0 | 579.2 | |
| -27 | -27 | -27 | -27 | 11.00 | 301.32 | -28.74 | 68.04 | 0.5110 | 999999 | 999999 | |
| 0 | 3 | 0 | 2 | 8.49 | 308.69 | -21.37 | 67.80 | 0.3910 | 569.0 | 609.3 | |
| 7 | -27 | 4 | -27 | 10.61 | 302.28 | -27.78 | 68.16 | 0.4956 | -1861.0 | 999999 | |
| 0 | 5 | 0 | 3 | 8.50 | 308.29 | -21.77 | 68.11 | 0.3970 | 610.0 | 550.1 | |
| 0 | 5 | 0 | 3 | 11.31 | 299.59 | -30.46 | 68.52 | 0.5364 | -113.0 | -216.4 | |
| 0 | 3 | 0 | 2 | 8.19 | 308.62 | -21.44 | 68.59 | 0.3903 | 817.0 | 705.1 | |
| 0 | 4 | 0 | 2 | 7.83 | 309.65 | -20.41 | 68.56 | 0.3728 | 964.0 | 898.3 | |
| 0 | 4 | 0 | 2 | 10.21 | 299.52 | -30.54 | 70.53 | 0.5325 | -527.0 | -458.4 | |
| Proj. U | - Projected umbra area in millionths of solar disc, negative values indicate | |
|
that the umbra consists of fragmented regions which cannot be separated without losing umbral area. In this way several spots (intensity minima in the umbra) have a common umbra, e.g. -2 means that the given spot shares an umbra with spot No.2, and the common U value is indicated at spot No.2. |
||
| Proj. WS | - Projected whole spot area in millionths of solar disc, negative values indicate | |
|
that several umbras have a common penumbra, e.g. -7 means that the given umbra shares a penumbra with umbra No.7, and the WS value is indicated at No.7. |
||
| Corr. U | - Corrected umbra area in millionths of solar hemisphere, for negative values see above | |
| Corr. WS | - Corrected whole spot area in millionths of solar hemisphere, for negative values see above | |
| B | - Heliographic latitude B; positive: North, negative: South | |
| L | - Heliographic longitude L | |
| LCM | - Longitudinal distance from the Sun's central meridian | |
| Pos. angle | - Position angle | |
| r | - Distance from the centre of Sun's disc in terms of Sun's radius | |
| MU | - Mean magnetic field within the umbra contour averaged the pixel values with sign. | |
| MP | - Mean magnetic field within the penumbra contour averaged the pixel values with sign. | |