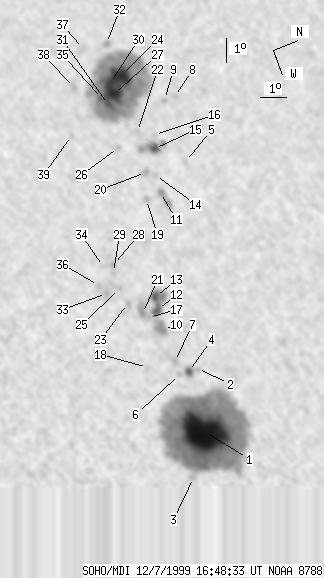
SOHO MDI 1999-12-07 16:48:33 UT
| group | Proj. U | Proj. WS | Corr. U | Corr. WS | B | L | LCM | Pos. angle | r | MU | MP |
| 237 | 1676 | 126 | 897 | 10.16 | 309.96 | -18.37 | 58.17 | 0.3588 | 663.2 | 175.9 | |
|
previous
or next observation for the same group /
back to the solar disc SOHO MDI 1999-12-07 16:48:33 UT |
| spot | Proj. U | Proj. WS | Corr. U | Corr. WS | B | L | LCM | Pos. angle | r | MU | MP |
| 136 | 865 | 70 | 444 | 9.56 | 316.31 | -12.02 | 51.10 | 0.2651 | 2159.0 | 724.2 | |
| 0 | 4 | 0 | 2 | 10.15 | 313.79 | -14.54 | 54.56 | 0.3048 | 658.0 | 473.0 | |
| 0 | 6 | 0 | 3 | 8.50 | 317.84 | -10.50 | 50.69 | 0.2339 | 286.0 | 261.0 | |
| 5 | 14 | 3 | 8 | 9.78 | 313.79 | -14.54 | 55.57 | 0.3014 | 1001.8 | 788.3 | |
| 0 | 4 | 0 | 2 | 12.60 | 305.47 | -22.87 | 60.13 | 0.4392 | -442.0 | -422.1 | |
| 0 | 4 | 0 | 2 | 9.42 | 313.79 | -14.54 | 56.61 | 0.2981 | 774.0 | 583.0 | |
| 0 | 5 | 0 | 3 | 9.41 | 313.23 | -15.10 | 57.57 | 0.3059 | 364.0 | 393.7 | |
| 0 | 5 | 0 | 3 | 13.10 | 302.63 | -25.70 | 61.81 | 0.4813 | 144.0 | 207.5 | |
| 0 | 4 | 0 | 2 | 12.69 | 302.64 | -25.69 | 62.57 | 0.4785 | 80.0 | -211.9 | |
| 0 | 23 | 0 | 12 | 9.46 | 311.87 | -16.47 | 59.60 | 0.3257 | 1399.0 | 1135.0 | |
| 0 | 26 | 0 | 14 | 11.25 | 306.43 | -21.90 | 61.96 | 0.4163 | -896.0 | -824.9 | |
| 8 | 47 | 4 | 25 | 9.52 | 311.02 | -17.32 | 60.65 | 0.3383 | 1146.1 | 795.7 | |
| 7 | -12 | 4 | -12 | 9.63 | 310.49 | -17.84 | 61.08 | 0.3467 | 1041.8 | 999999 | |
| 0 | 5 | 0 | 3 | 11.30 | 305.68 | -22.65 | 62.60 | 0.4272 | -796.0 | -736.5 | |
| 6 | 36 | 3 | 20 | 11.64 | 304.57 | -23.77 | 62.95 | 0.4451 | 983.7 | 522.6 | |
| 0 | 4 | 0 | 2 | 11.84 | 303.99 | -24.35 | 63.08 | 0.4544 | -643.0 | -476.0 | |
| 0 | 3 | 0 | 2 | 9.08 | 311.21 | -17.12 | 61.54 | 0.3321 | 778.0 | 863.1 | |
| 0 | 5 | 0 | 3 | 8.36 | 313.12 | -15.22 | 60.82 | 0.2988 | 964.0 | 765.2 | |
| 0 | 5 | 0 | 3 | 10.64 | 306.55 | -21.79 | 63.18 | 0.4105 | 296.0 | 300.4 | |
| 0 | 7 | 0 | 4 | 10.98 | 305.44 | -22.89 | 63.52 | 0.4285 | -1033.0 | -891.4 | |
| 0 | 17 | 0 | 9 | 8.92 | 310.98 | -17.35 | 62.29 | 0.3343 | 1145.0 | 1002.8 | |
| 0 | 3 | 0 | 2 | 11.26 | 303.66 | -24.67 | 64.53 | 0.4554 | -486.0 | -516.8 | |
| 0 | 6 | 0 | 3 | 8.52 | 310.41 | -17.93 | 64.10 | 0.3399 | 741.0 | 775.3 | |
| 30 | 525 | 17 | 297 | 11.46 | 301.12 | -27.21 | 66.12 | 0.4922 | -1393.7 | -691.0 | |
| 0 | 3 | 0 | 2 | 8.43 | 309.72 | -18.61 | 65.12 | 0.3495 | 774.0 | 725.5 | |
| 0 | 4 | 0 | 2 | 10.35 | 304.09 | -24.24 | 66.06 | 0.4438 | -907.0 | -826.7 | |
| 18 | -24 | 10 | -24 | 10.95 | 301.80 | -26.53 | 66.61 | 0.4799 | -1956.7 | 999999 | |
| 0 | 5 | 0 | 3 | 8.55 | 308.71 | -19.62 | 65.93 | 0.3653 | 734.0 | 694.5 | |
| 0 | 3 | 0 | 1 | 8.44 | 309.03 | -19.31 | 65.88 | 0.3600 | 637.0 | 530.9 | |
| 14 | -24 | 8 | -24 | 10.91 | 301.32 | -27.02 | 67.04 | 0.4864 | -1580.4 | 999999 | |
| 6 | -24 | 3 | -24 | 10.58 | 302.19 | -26.14 | 67.06 | 0.4723 | -1955.2 | 999999 | |
| 0 | 6 | 0 | 4 | 11.36 | 299.57 | -28.76 | 67.37 | 0.5132 | -96.0 | -171.7 | |
| 0 | 6 | 0 | 3 | 7.90 | 309.75 | -18.58 | 66.53 | 0.3457 | 912.0 | 848.3 | |
| 0 | 1 | 0 | 0 | 8.16 | 308.66 | -19.67 | 66.97 | 0.3637 | 708.0 | 697.6 | |
| 7 | -24 | 4 | -24 | 10.45 | 301.87 | -26.47 | 67.56 | 0.4762 | -1544.9 | 999999 | |
| 0 | 5 | 0 | 2 | 7.72 | 309.34 | -19.00 | 67.44 | 0.3508 | 867.0 | 748.6 | |
| 0 | 10 | 0 | 6 | 10.45 | 299.51 | -28.82 | 69.09 | 0.5096 | -419.0 | -447.0 | |
| 0 | 5 | 0 | 3 | 9.58 | 301.06 | -27.27 | 69.81 | 0.4835 | -909.0 | -773.6 | |
| 0 | 5 | 0 | 3 | 8.81 | 303.02 | -25.32 | 70.11 | 0.4513 | -731.0 | -659.0 | |
| Proj. U | - Projected umbra area in millionths of solar disc, negative values indicate | |
|
that the umbra consists of fragmented regions which cannot be separated without losing umbral area. In this way several spots (intensity minima in the umbra) have a common umbra, e.g. -2 means that the given spot shares an umbra with spot No.2, and the common U value is indicated at spot No.2. |
||
| Proj. WS | - Projected whole spot area in millionths of solar disc, negative values indicate | |
|
that several umbras have a common penumbra, e.g. -7 means that the given umbra shares a penumbra with umbra No.7, and the WS value is indicated at No.7. |
||
| Corr. U | - Corrected umbra area in millionths of solar hemisphere, for negative values see above | |
| Corr. WS | - Corrected whole spot area in millionths of solar hemisphere, for negative values see above | |
| B | - Heliographic latitude B; positive: North, negative: South | |
| L | - Heliographic longitude L | |
| LCM | - Longitudinal distance from the Sun's central meridian | |
| Pos. angle | - Position angle | |
| r | - Distance from the centre of Sun's disc in terms of Sun's radius | |
| MU | - Mean magnetic field within the umbra contour averaged the pixel values with sign. | |
| MP | - Mean magnetic field within the penumbra contour averaged the pixel values with sign. | |