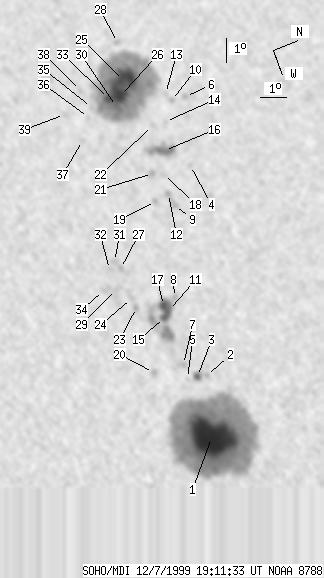
SOHO MDI 1999-12-07 19:11:33 UT
| group | Proj. U | Proj. WS | Corr. U | Corr. WS | B | L | LCM | Pos. angle | r | MU | MP |
| 239 | 1685 | 126 | 892 | 10.06 | 310.16 | -16.87 | 56.00 | 0.3377 | 723.5 | 197.7 | |
|
previous
or next observation for the same group /
back to the solar disc SOHO MDI 1999-12-07 19:11:33 UT |
| spot | Proj. U | Proj. WS | Corr. U | Corr. WS | B | L | LCM | Pos. angle | r | MU | MP |
| 141 | 868 | 72 | 443 | 9.46 | 316.33 | -10.69 | 48.08 | 0.2471 | 2170.4 | 706.3 | |
| 0 | 3 | 0 | 2 | 10.14 | 313.94 | -13.09 | 51.70 | 0.2853 | 686.0 | 563.7 | |
| 4 | 12 | 2 | 6 | 9.80 | 313.86 | -13.16 | 52.83 | 0.2829 | 1070.5 | 735.7 | |
| 0 | 4 | 0 | 2 | 12.48 | 305.53 | -21.49 | 58.87 | 0.4197 | -589.0 | -493.9 | |
| 0 | 3 | 0 | 2 | 9.41 | 313.81 | -13.21 | 54.07 | 0.2798 | 514.0 | 451.9 | |
| 0 | 4 | 0 | 2 | 13.26 | 302.63 | -24.39 | 60.29 | 0.4648 | 597.0 | 532.2 | |
| 0 | 7 | 0 | 4 | 9.46 | 313.23 | -13.80 | 55.07 | 0.2882 | 844.0 | 808.0 | |
| 0 | 7 | 0 | 4 | 10.06 | 310.56 | -16.47 | 57.97 | 0.3307 | 523.0 | 434.2 | |
| 0 | 9 | 0 | 5 | 11.34 | 306.95 | -20.08 | 59.72 | 0.3915 | -956.0 | -805.2 | |
| 0 | 5 | 0 | 3 | 12.69 | 302.64 | -24.39 | 61.39 | 0.4608 | -486.0 | -383.2 | |
| 5 | 102 | 3 | 53 | 9.66 | 310.98 | -16.04 | 58.38 | 0.3214 | 1146.0 | 953.7 | |
| 0 | 4 | 0 | 2 | 11.29 | 306.40 | -20.63 | 60.48 | 0.3988 | -937.0 | -843.2 | |
| 0 | 3 | 0 | 2 | 12.57 | 302.28 | -24.75 | 61.96 | 0.4649 | 104.0 | -126.2 | |
| 0 | 3 | 0 | 2 | 12.18 | 303.44 | -23.59 | 61.66 | 0.4463 | -777.0 | -618.4 | |
| 5 | -11 | 3 | -11 | 9.42 | 311.20 | -15.83 | 58.70 | 0.3163 | 1374.5 | 999999 | |
| 11 | 44 | 6 | 24 | 11.74 | 304.62 | -22.41 | 61.41 | 0.4269 | 1025.0 | 517.6 | |
| 5 | -11 | 3 | -11 | 9.55 | 310.73 | -16.30 | 59.07 | 0.3241 | 1068.8 | 999999 | |
| 0 | 3 | 0 | 2 | 11.37 | 305.58 | -21.45 | 61.21 | 0.4109 | -788.0 | -770.5 | |
| 0 | 4 | 0 | 2 | 10.70 | 306.56 | -20.47 | 61.62 | 0.3922 | 461.0 | 287.0 | |
| 0 | 7 | 0 | 4 | 8.26 | 313.15 | -13.88 | 58.82 | 0.2787 | 952.0 | 784.6 | |
| 0 | 7 | 0 | 4 | 10.98 | 305.40 | -21.62 | 62.24 | 0.4106 | -1117.0 | -835.7 | |
| 0 | 5 | 0 | 3 | 11.65 | 303.45 | -23.58 | 62.74 | 0.4426 | -680.0 | -567.5 | |
| 0 | 6 | 0 | 3 | 8.55 | 310.46 | -16.57 | 62.22 | 0.3201 | 1067.0 | 830.2 | |
| 0 | 11 | 0 | 6 | 8.49 | 310.05 | -16.98 | 62.93 | 0.3257 | 569.0 | 531.0 | |
| 38 | 502 | 21 | 281 | 11.22 | 301.24 | -25.79 | 65.50 | 0.4709 | -1534.1 | -727.7 | |
| 20 | -25 | 11 | -25 | 10.90 | 301.83 | -25.20 | 65.67 | 0.4608 | -2058.7 | 999999 | |
| 0 | 5 | 0 | 2 | 8.51 | 308.75 | -18.27 | 64.51 | 0.3451 | 885.0 | 690.1 | |
| 0 | 5 | 0 | 3 | 11.53 | 299.56 | -27.46 | 66.15 | 0.4962 | -29.0 | 35.1 | |
| 0 | 16 | 0 | 8 | 8.07 | 309.51 | -17.51 | 64.78 | 0.3308 | 848.0 | 775.6 | |
| 2 | -25 | 1 | -25 | 10.60 | 302.23 | -24.79 | 65.95 | 0.4533 | -1925.5 | 999999 | |
| 0 | 6 | 0 | 3 | 8.39 | 308.41 | -18.62 | 65.23 | 0.3495 | 741.0 | 621.3 | |
| 0 | 4 | 0 | 2 | 8.10 | 308.65 | -18.37 | 65.73 | 0.3439 | 736.0 | 648.9 | |
| 8 | -25 | 4 | -25 | 10.42 | 301.81 | -25.22 | 66.66 | 0.4584 | -1717.0 | 999999 | |
| 0 | 8 | 0 | 4 | 7.59 | 309.38 | -17.64 | 66.28 | 0.3296 | 616.0 | 648.3 | |
| 0 | 3 | 0 | 2 | 9.68 | 301.97 | -25.06 | 68.07 | 0.4520 | -260.0 | -282.6 | |
| 0 | 4 | 0 | 2 | 9.44 | 302.34 | -24.68 | 68.31 | 0.4452 | -638.0 | -619.9 | |
| 0 | 4 | 0 | 2 | 8.90 | 303.21 | -23.82 | 68.82 | 0.4298 | -934.0 | -756.0 | |
| 0 | 3 | 0 | 1 | 9.52 | 301.13 | -25.90 | 69.00 | 0.4633 | -871.0 | -702.4 | |
| 0 | 4 | 0 | 2 | 8.61 | 301.92 | -25.11 | 70.37 | 0.4473 | -610.0 | -527.9 | |
| Proj. U | - Projected umbra area in millionths of solar disc, negative values indicate | |
|
that the umbra consists of fragmented regions which cannot be separated without losing umbral area. In this way several spots (intensity minima in the umbra) have a common umbra, e.g. -2 means that the given spot shares an umbra with spot No.2, and the common U value is indicated at spot No.2. |
||
| Proj. WS | - Projected whole spot area in millionths of solar disc, negative values indicate | |
|
that several umbras have a common penumbra, e.g. -7 means that the given umbra shares a penumbra with umbra No.7, and the WS value is indicated at No.7. |
||
| Corr. U | - Corrected umbra area in millionths of solar hemisphere, for negative values see above | |
| Corr. WS | - Corrected whole spot area in millionths of solar hemisphere, for negative values see above | |
| B | - Heliographic latitude B; positive: North, negative: South | |
| L | - Heliographic longitude L | |
| LCM | - Longitudinal distance from the Sun's central meridian | |
| Pos. angle | - Position angle | |
| r | - Distance from the centre of Sun's disc in terms of Sun's radius | |
| MU | - Mean magnetic field within the umbra contour averaged the pixel values with sign. | |
| MP | - Mean magnetic field within the penumbra contour averaged the pixel values with sign. | |