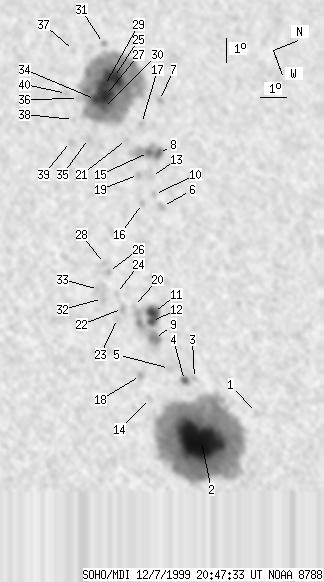
SOHO MDI 1999-12-07 20:47:33 UT
| group | Proj. U | Proj. WS | Corr. U | Corr. WS | B | L | LCM | Pos. angle | r | MU | MP |
| 231 | 1665 | 121 | 878 | 10.12 | 310.26 | -15.89 | 53.84 | 0.3256 | 788.8 | 159.8 | |
|
previous
or next observation for the same group /
back to the solar disc SOHO MDI 1999-12-07 20:47:33 UT |
| spot | Proj. U | Proj. WS | Corr. U | Corr. WS | B | L | LCM | Pos. angle | r | MU | MP |
| 0 | 3 | 0 | 2 | 11.95 | 316.04 | -10.11 | 39.65 | 0.2703 | -685.0 | -488.1 | |
| 137 | 886 | 70 | 451 | 9.55 | 316.42 | -9.73 | 45.13 | 0.2363 | 2169.7 | 710.5 | |
| 0 | 4 | 0 | 2 | 10.17 | 313.97 | -12.18 | 49.62 | 0.2738 | 520.0 | 431.9 | |
| 4 | 11 | 2 | 6 | 9.78 | 313.92 | -12.23 | 50.86 | 0.2704 | 1020.7 | 767.9 | |
| 0 | 6 | 0 | 3 | 9.40 | 313.27 | -12.87 | 53.38 | 0.2752 | 971.0 | 850.6 | |
| 0 | 7 | 0 | 4 | 11.39 | 306.94 | -19.21 | 58.51 | 0.3799 | -956.0 | -826.8 | |
| 0 | 5 | 0 | 3 | 12.76 | 302.61 | -23.53 | 60.43 | 0.4497 | -486.0 | -317.2 | |
| 6 | 52 | 3 | 28 | 11.99 | 304.77 | -21.38 | 59.78 | 0.4145 | 1054.2 | 476.5 | |
| 7 | 19 | 3 | 10 | 9.27 | 311.95 | -14.20 | 56.35 | 0.2922 | 1445.7 | 1169.2 | |
| 0 | 4 | 0 | 2 | 11.27 | 306.36 | -19.78 | 59.51 | 0.3869 | -845.0 | -670.5 | |
| 11 | 55 | 6 | 29 | 9.60 | 310.95 | -15.20 | 57.18 | 0.3091 | 1145.0 | 967.3 | |
| 5 | -11 | 3 | -11 | 9.40 | 311.26 | -14.88 | 57.19 | 0.3029 | 1437.3 | 999999 | |
| 0 | 13 | 0 | 7 | 11.41 | 305.61 | -20.54 | 60.08 | 0.3985 | -890.0 | -710.7 | |
| 0 | 5 | 0 | 2 | 8.26 | 314.14 | -12.01 | 55.07 | 0.2523 | 614.0 | 512.1 | |
| 4 | -8 | 2 | -8 | 11.64 | 304.61 | -21.54 | 60.71 | 0.4141 | 882.6 | 999999 | |
| 0 | 5 | 0 | 3 | 10.71 | 306.57 | -19.57 | 60.55 | 0.3797 | 296.0 | 154.3 | |
| 0 | 5 | 0 | 3 | 11.78 | 303.35 | -22.80 | 61.70 | 0.4327 | -472.0 | -472.3 | |
| 0 | 6 | 0 | 3 | 8.26 | 313.16 | -12.98 | 57.14 | 0.2659 | 850.0 | 795.8 | |
| 0 | 6 | 0 | 3 | 10.96 | 305.37 | -20.78 | 61.35 | 0.3986 | -899.0 | -833.6 | |
| 0 | 4 | 0 | 2 | 8.95 | 310.46 | -15.69 | 59.76 | 0.3105 | 561.0 | 477.3 | |
| 0 | 3 | 0 | 2 | 11.01 | 303.82 | -22.33 | 62.87 | 0.4209 | -773.0 | -668.8 | |
| 0 | 5 | 0 | 3 | 8.53 | 310.40 | -15.75 | 61.07 | 0.3081 | 896.0 | 799.1 | |
| 0 | 5 | 0 | 3 | 8.21 | 310.72 | -15.43 | 61.52 | 0.3010 | 831.0 | 753.8 | |
| 0 | 4 | 0 | 2 | 8.52 | 309.75 | -16.40 | 62.04 | 0.3175 | 566.0 | 529.3 | |
| 22 | 504 | 13 | 280 | 11.40 | 301.12 | -25.03 | 64.50 | 0.4614 | -1474.6 | -749.8 | |
| 0 | 6 | 0 | 3 | 8.53 | 308.80 | -17.35 | 63.28 | 0.3316 | 784.0 | 599.9 | |
| 14 | -25 | 8 | -25 | 10.86 | 301.77 | -24.38 | 65.06 | 0.4490 | -2136.3 | 999999 | |
| 0 | 4 | 0 | 2 | 8.50 | 308.44 | -17.71 | 63.82 | 0.3367 | 672.0 | 500.3 | |
| 6 | -25 | 3 | -25 | 10.97 | 301.34 | -24.81 | 65.21 | 0.4556 | -1661.6 | 999999 | |
| 6 | -25 | 3 | -25 | 10.61 | 302.28 | -23.87 | 65.16 | 0.4402 | -1902.2 | 999999 | |
| 0 | 6 | 0 | 3 | 11.51 | 299.57 | -26.57 | 65.51 | 0.4837 | 311.0 | 126.4 | |
| 0 | 5 | 0 | 2 | 7.94 | 309.76 | -16.39 | 63.67 | 0.3132 | 933.0 | 875.0 | |
| 0 | 4 | 0 | 2 | 7.92 | 309.36 | -16.78 | 64.25 | 0.3190 | 863.0 | 692.9 | |
| 9 | -25 | 5 | -25 | 10.44 | 301.81 | -24.34 | 65.90 | 0.4459 | -1811.2 | 999999 | |
| 0 | 5 | 0 | 3 | 9.65 | 303.31 | -22.84 | 66.34 | 0.4195 | -1023.0 | -920.6 | |
| 0 | 3 | 0 | 2 | 9.84 | 301.56 | -24.59 | 67.36 | 0.4461 | -707.0 | -712.2 | |
| 0 | 4 | 0 | 2 | 10.32 | 299.51 | -26.64 | 67.88 | 0.4782 | -580.0 | -500.9 | |
| 0 | 3 | 0 | 2 | 9.37 | 302.36 | -23.79 | 67.75 | 0.4319 | -574.0 | -530.4 | |
| 0 | 4 | 0 | 2 | 8.96 | 303.21 | -22.94 | 67.98 | 0.4171 | -759.0 | -726.3 | |
| 0 | 4 | 0 | 2 | 9.47 | 301.21 | -24.94 | 68.40 | 0.4493 | -854.0 | -718.8 | |
| Proj. U | - Projected umbra area in millionths of solar disc, negative values indicate | |
|
that the umbra consists of fragmented regions which cannot be separated without losing umbral area. In this way several spots (intensity minima in the umbra) have a common umbra, e.g. -2 means that the given spot shares an umbra with spot No.2, and the common U value is indicated at spot No.2. |
||
| Proj. WS | - Projected whole spot area in millionths of solar disc, negative values indicate | |
|
that several umbras have a common penumbra, e.g. -7 means that the given umbra shares a penumbra with umbra No.7, and the WS value is indicated at No.7. |
||
| Corr. U | - Corrected umbra area in millionths of solar hemisphere, for negative values see above | |
| Corr. WS | - Corrected whole spot area in millionths of solar hemisphere, for negative values see above | |
| B | - Heliographic latitude B; positive: North, negative: South | |
| L | - Heliographic longitude L | |
| LCM | - Longitudinal distance from the Sun's central meridian | |
| Pos. angle | - Position angle | |
| r | - Distance from the centre of Sun's disc in terms of Sun's radius | |
| MU | - Mean magnetic field within the umbra contour averaged the pixel values with sign. | |
| MP | - Mean magnetic field within the penumbra contour averaged the pixel values with sign. | |