SOHO MDI 1999-12-07 23:59:33 UT
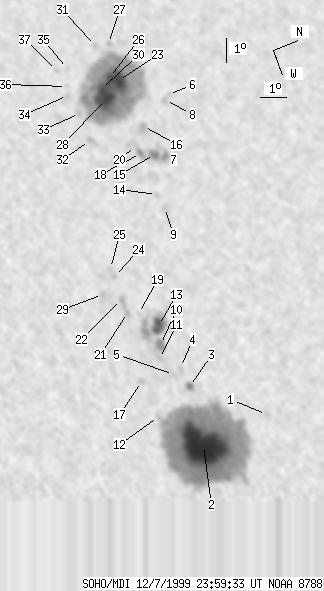
| group | Proj. U | Proj. WS | Corr. U | Corr. WS | B | L | LCM | Pos. angle | r | MU | MP |
| 265 | 1661 | 137 | 869 | 10.10 | 310.06 | -14.33 | 50.40 | 0.3055 | 699.7 | 174.9 | |
|
previous
or next observation for the same group /
back to the solar disc SOHO MDI 1999-12-07 23:59:33 UT |
| spot | Proj. U | Proj. WS | Corr. U | Corr. WS | B | L | LCM | Pos. angle | r | MU | MP |
| 0 | 2 | 0 | 1 | 12.20 | 316.03 | -8.36 | 33.89 | 0.2561 | -349.0 | -359.4 | |
| 151 | 864 | 76 | 438 | 9.48 | 316.36 | -8.03 | 39.88 | 0.2160 | 2152.0 | 717.9 | |
| 4 | 10 | 2 | 5 | 9.79 | 313.99 | -10.40 | 46.26 | 0.2475 | 1035.0 | 787.8 | |
| 0 | 5 | 0 | 3 | 9.72 | 313.16 | -11.23 | 48.60 | 0.2571 | 656.0 | 574.7 | |
| 0 | 3 | 0 | 2 | 9.37 | 313.33 | -11.06 | 49.23 | 0.2510 | 801.0 | 879.4 | |
| 0 | 2 | 0 | 1 | 13.09 | 302.38 | -22.02 | 58.16 | 0.4317 | 356.0 | 323.3 | |
| 2 | 62 | 1 | 33 | 12.11 | 304.84 | -19.55 | 57.29 | 0.3905 | 1045.3 | 502.6 | |
| 0 | 4 | 0 | 2 | 12.89 | 302.59 | -21.81 | 58.32 | 0.4273 | -176.0 | -281.3 | |
| 0 | 7 | 0 | 4 | 11.36 | 306.85 | -17.55 | 56.27 | 0.3570 | -905.0 | -677.8 | |
| 7 | 17 | 4 | 9 | 9.32 | 312.04 | -12.35 | 52.45 | 0.2674 | 1339.4 | 1076.3 | |
| 0 | 6 | 0 | 3 | 9.09 | 312.56 | -11.84 | 52.00 | 0.2582 | 1117.0 | 1018.8 | |
| 0 | 5 | 0 | 3 | 8.25 | 314.70 | -9.69 | 49.20 | 0.2211 | 303.0 | 374.4 | |
| 16 | 68 | 8 | 35 | 9.51 | 311.30 | -13.09 | 53.47 | 0.2793 | 1306.2 | 901.7 | |
| 0 | 4 | 0 | 2 | 11.25 | 306.24 | -18.15 | 57.40 | 0.3643 | -552.0 | -525.2 | |
| 5 | -7 | 3 | -7 | 11.74 | 304.63 | -19.76 | 58.39 | 0.3904 | 1062.0 | 999999 | |
| 0 | 9 | 0 | 5 | 11.72 | 303.38 | -21.01 | 59.90 | 0.4076 | -1097.0 | -815.3 | |
| 0 | 5 | 0 | 3 | 8.12 | 313.18 | -11.21 | 53.67 | 0.2400 | 885.0 | 762.9 | |
| 3 | -7 | 1 | -7 | 11.24 | 304.42 | -19.97 | 59.76 | 0.3894 | 441.8 | 999999 | |
| 0 | 2 | 0 | 1 | 8.95 | 310.59 | -13.80 | 56.51 | 0.2838 | 707.0 | 635.5 | |
| 0 | 13 | 0 | 7 | 11.17 | 304.04 | -20.35 | 60.37 | 0.3942 | -116.0 | -400.0 | |
| 0 | 6 | 0 | 3 | 8.56 | 310.41 | -13.98 | 58.00 | 0.2829 | 1000.0 | 844.4 | |
| 0 | 8 | 0 | 4 | 8.53 | 309.85 | -14.55 | 59.11 | 0.2908 | 414.0 | 466.2 | |
| 25 | 513 | 14 | 281 | 11.45 | 301.21 | -23.18 | 62.72 | 0.4359 | -1544.3 | -728.6 | |
| 0 | 5 | 0 | 2 | 8.59 | 308.88 | -15.51 | 60.48 | 0.3052 | 618.0 | 637.0 | |
| 0 | 4 | 0 | 2 | 8.56 | 308.53 | -15.87 | 61.12 | 0.3102 | 641.0 | 488.1 | |
| 11 | -23 | 6 | -23 | 11.17 | 300.98 | -23.41 | 63.54 | 0.4373 | -1356.3 | 999999 | |
| 0 | 4 | 0 | 2 | 11.61 | 299.57 | -24.82 | 63.90 | 0.4599 | 263.0 | 94.3 | |
| 30 | -23 | 16 | -23 | 10.72 | 301.83 | -22.56 | 63.71 | 0.4223 | -2075.9 | 999999 | |
| 0 | 4 | 0 | 2 | 7.91 | 309.41 | -14.98 | 61.68 | 0.2922 | 1041.0 | 853.6 | |
| 11 | -23 | 6 | -23 | 10.72 | 301.33 | -23.06 | 64.15 | 0.4294 | -1562.6 | 999999 | |
| 0 | 4 | 0 | 2 | 11.10 | 299.50 | -24.90 | 64.97 | 0.4578 | -737.0 | -565.2 | |
| 0 | 7 | 0 | 4 | 9.57 | 303.28 | -21.11 | 64.88 | 0.3940 | -1070.0 | -917.6 | |
| 0 | 4 | 0 | 2 | 9.58 | 302.08 | -22.32 | 66.00 | 0.4117 | -795.0 | -607.3 | |
| 0 | 3 | 0 | 2 | 9.39 | 301.20 | -23.19 | 67.17 | 0.4234 | -790.0 | -749.6 | |
| 0 | 4 | 0 | 2 | 9.77 | 300.10 | -24.29 | 67.25 | 0.4415 | -683.0 | -720.3 | |
| 0 | 3 | 0 | 2 | 9.48 | 300.82 | -23.57 | 67.29 | 0.4294 | -711.0 | -553.1 | |
| 0 | 4 | 0 | 2 | 9.34 | 300.05 | -24.34 | 68.21 | 0.4399 | -521.0 | -581.0 | |
| Proj. U | - Projected umbra area in millionths of solar disc, negative values indicate | |
|
that the umbra consists of fragmented regions which cannot be separated without losing umbral area. In this way several spots (intensity minima in the umbra) have a common umbra, e.g. -2 means that the given spot shares an umbra with spot No.2, and the common U value is indicated at spot No.2. |
||
| Proj. WS | - Projected whole spot area in millionths of solar disc, negative values indicate | |
|
that several umbras have a common penumbra, e.g. -7 means that the given umbra shares a penumbra with umbra No.7, and the WS value is indicated at No.7. |
||
| Corr. U | - Corrected umbra area in millionths of solar hemisphere, for negative values see above | |
| Corr. WS | - Corrected whole spot area in millionths of solar hemisphere, for negative values see above | |
| B | - Heliographic latitude B; positive: North, negative: South | |
| L | - Heliographic longitude L | |
| LCM | - Longitudinal distance from the Sun's central meridian | |
| Pos. angle | - Position angle | |
| r | - Distance from the centre of Sun's disc in terms of Sun's radius | |
| MU | - Mean magnetic field within the umbra contour averaged the pixel values with sign. | |
| MP | - Mean magnetic field within the penumbra contour averaged the pixel values with sign. | |