SOHO MDI 1999-12-08 01:35:33 UT
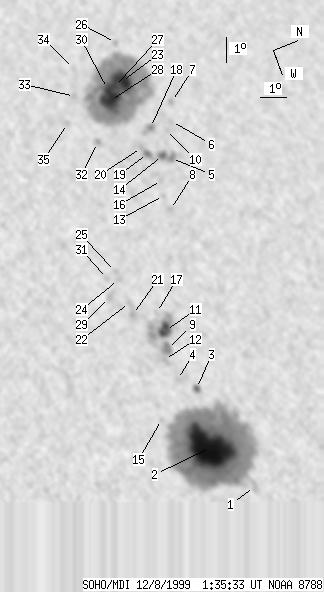
| group | Proj. U | Proj. WS | Corr. U | Corr. WS | B | L | LCM | Pos. angle | r | MU | MP |
| 254 | 1666 | 131 | 868 | 10.07 | 310.21 | -13.30 | 48.00 | 0.2927 | 689.3 | 186.7 | |
|
previous
or next observation for the same group /
back to the solar disc SOHO MDI 1999-12-08 01:35:33 UT |
| spot | Proj. U | Proj. WS | Corr. U | Corr. WS | B | L | LCM | Pos. angle | r | MU | MP |
| 0 | 11 | 0 | 5 | 10.56 | 318.39 | -5.13 | 25.56 | 0.2046 | 42.0 | 15.8 | |
| 146 | 862 | 74 | 436 | 9.50 | 316.37 | -7.14 | 36.53 | 0.2070 | 2171.2 | 728.1 | |
| 3 | 8 | 2 | 4 | 9.81 | 314.01 | -9.51 | 43.61 | 0.2371 | 1004.8 | 812.0 | |
| 0 | 15 | 0 | 8 | 9.25 | 313.43 | -10.09 | 47.01 | 0.2374 | 928.0 | 789.9 | |
| 2 | 24 | 1 | 13 | 12.10 | 304.90 | -18.62 | 56.06 | 0.3779 | 1079.6 | 823.3 | |
| 0 | 4 | 0 | 2 | 12.62 | 303.42 | -20.09 | 56.86 | 0.4021 | -722.0 | -599.8 | |
| 0 | 4 | 0 | 2 | 12.90 | 302.61 | -20.90 | 57.25 | 0.4152 | -532.0 | -402.1 | |
| 0 | 4 | 0 | 2 | 11.35 | 306.88 | -16.63 | 54.89 | 0.3445 | -877.0 | -595.3 | |
| 5 | 15 | 2 | 8 | 9.31 | 312.14 | -11.37 | 50.17 | 0.2546 | 1330.9 | 1158.2 | |
| 0 | 3 | 0 | 2 | 12.32 | 303.68 | -19.83 | 57.17 | 0.3962 | -662.0 | -530.5 | |
| 15 | 81 | 7 | 41 | 9.49 | 311.44 | -12.07 | 51.29 | 0.2656 | 1309.6 | 871.9 | |
| 0 | 6 | 0 | 3 | 9.05 | 312.51 | -11.00 | 50.06 | 0.2469 | 1062.0 | 965.9 | |
| 0 | 4 | 0 | 2 | 11.29 | 306.25 | -17.26 | 56.00 | 0.3525 | -654.0 | -559.5 | |
| 4 | -5 | 2 | -5 | 11.81 | 304.67 | -18.85 | 57.02 | 0.3786 | 1145.0 | 999999 | |
| 0 | 3 | 0 | 2 | 8.12 | 314.70 | -8.82 | 46.97 | 0.2086 | 617.0 | 478.3 | |
| 0 | 5 | 0 | 2 | 11.43 | 305.64 | -17.87 | 56.57 | 0.3621 | -849.0 | -698.5 | |
| 0 | 4 | 0 | 2 | 9.41 | 310.65 | -12.87 | 53.25 | 0.2754 | 559.0 | 516.3 | |
| 2 | 14 | 1 | 8 | 11.76 | 303.41 | -20.10 | 58.73 | 0.3954 | -1188.2 | -790.0 | |
| 3 | 14 | 2 | 8 | 11.29 | 304.41 | -19.11 | 58.56 | 0.3779 | 720.0 | 500.4 | |
| 0 | 12 | 0 | 7 | 11.16 | 304.10 | -19.42 | 59.26 | 0.3812 | -162.0 | -320.6 | |
| 0 | 5 | 0 | 3 | 8.52 | 310.42 | -13.10 | 56.46 | 0.2701 | 1001.0 | 884.5 | |
| 0 | 8 | 0 | 4 | 8.57 | 309.93 | -13.59 | 57.23 | 0.2776 | 591.0 | 447.9 | |
| 28 | 520 | 15 | 283 | 11.35 | 301.21 | -22.30 | 62.08 | 0.4230 | -1591.9 | -726.5 | |
| 0 | 3 | 0 | 2 | 8.49 | 308.92 | -14.60 | 59.27 | 0.2913 | 833.0 | 732.9 | |
| 0 | 3 | 0 | 1 | 8.50 | 308.57 | -14.94 | 59.83 | 0.2963 | 516.0 | 525.9 | |
| 0 | 4 | 0 | 2 | 11.67 | 299.54 | -23.97 | 63.00 | 0.4485 | 203.0 | 167.8 | |
| 3 | -23 | 2 | -23 | 11.02 | 301.33 | -22.19 | 62.66 | 0.4191 | -1813.5 | 999999 | |
| 32 | -23 | 17 | -23 | 10.68 | 301.84 | -21.67 | 62.88 | 0.4095 | -2081.5 | 999999 | |
| 0 | 10 | 0 | 5 | 7.92 | 309.48 | -14.03 | 60.07 | 0.2784 | 1047.0 | 764.5 | |
| 11 | -23 | 6 | -23 | 10.74 | 301.32 | -22.19 | 63.28 | 0.4173 | -1542.0 | 999999 | |
| 0 | 4 | 0 | 2 | 8.11 | 308.74 | -14.78 | 60.73 | 0.2908 | 870.0 | 704.1 | |
| 0 | 5 | 0 | 3 | 9.63 | 303.36 | -20.16 | 63.73 | 0.3806 | -1103.0 | -920.1 | |
| 0 | 4 | 0 | 2 | 9.43 | 301.24 | -22.28 | 66.28 | 0.4102 | -800.0 | -644.2 | |
| 0 | 1 | 0 | 1 | 9.78 | 300.10 | -23.42 | 66.49 | 0.4290 | -826.0 | -765.0 | |
| 0 | 6 | 0 | 3 | 8.80 | 302.23 | -21.29 | 66.83 | 0.3919 | -912.0 | -703.8 | |
| Proj. U | - Projected umbra area in millionths of solar disc, negative values indicate | |
|
that the umbra consists of fragmented regions which cannot be separated without losing umbral area. In this way several spots (intensity minima in the umbra) have a common umbra, e.g. -2 means that the given spot shares an umbra with spot No.2, and the common U value is indicated at spot No.2. |
||
| Proj. WS | - Projected whole spot area in millionths of solar disc, negative values indicate | |
|
that several umbras have a common penumbra, e.g. -7 means that the given umbra shares a penumbra with umbra No.7, and the WS value is indicated at No.7. |
||
| Corr. U | - Corrected umbra area in millionths of solar hemisphere, for negative values see above | |
| Corr. WS | - Corrected whole spot area in millionths of solar hemisphere, for negative values see above | |
| B | - Heliographic latitude B; positive: North, negative: South | |
| L | - Heliographic longitude L | |
| LCM | - Longitudinal distance from the Sun's central meridian | |
| Pos. angle | - Position angle | |
| r | - Distance from the centre of Sun's disc in terms of Sun's radius | |
| MU | - Mean magnetic field within the umbra contour averaged the pixel values with sign. | |
| MP | - Mean magnetic field within the penumbra contour averaged the pixel values with sign. | |