SOHO MDI 1999-12-08 08:44:33 UT
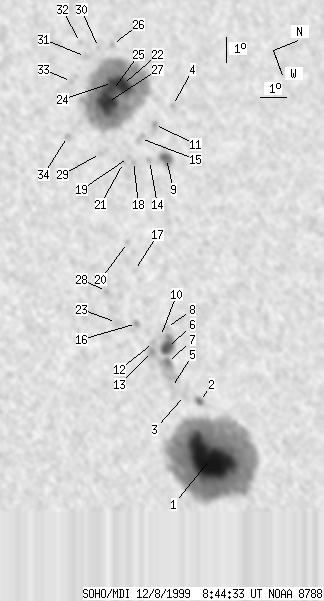
| group | Proj. U | Proj. WS | Corr. U | Corr. WS | B | L | LCM | Pos. angle | r | MU | MP |
| 255 | 1639 | 132 | 845 | 10.03 | 310.36 | -9.23 | 35.24 | 0.2490 | 712.3 | 196.8 | |
|
previous
or next observation for the same group /
back to the solar disc SOHO MDI 1999-12-08 08:44:33 UT |
| spot | Proj. U | Proj. WS | Corr. U | Corr. WS | B | L | LCM | Pos. angle | r | MU | MP |
| 149 | 878 | 75 | 442 | 9.49 | 316.42 | -3.17 | 18.21 | 0.1756 | 2201.3 | 717.9 | |
| 3 | 11 | 2 | 6 | 9.88 | 314.19 | -5.40 | 28.24 | 0.1969 | 1019.3 | 691.8 | |
| 0 | 7 | 0 | 4 | 9.42 | 313.77 | -5.82 | 31.27 | 0.1937 | 851.0 | 771.4 | |
| 0 | 4 | 0 | 2 | 13.02 | 302.66 | -16.93 | 51.43 | 0.3646 | -583.0 | -362.8 | |
| 0 | 3 | 0 | 2 | 9.06 | 313.30 | -6.29 | 34.30 | 0.1928 | 636.0 | 726.5 | |
| 13 | 34 | 7 | 17 | 9.47 | 311.78 | -7.81 | 38.99 | 0.2140 | 1405.4 | 858.1 | |
| 3 | 45 | 2 | 23 | 9.26 | 312.33 | -7.26 | 37.58 | 0.2054 | 1318.2 | 1076.0 | |
| 0 | 4 | 0 | 2 | 9.71 | 311.03 | -8.56 | 40.85 | 0.2254 | 699.0 | 601.5 | |
| 11 | 22 | 6 | 12 | 12.06 | 304.65 | -14.94 | 50.22 | 0.3296 | 1207.2 | 821.0 | |
| 0 | 3 | 0 | 1 | 9.36 | 311.28 | -8.31 | 41.03 | 0.2182 | 722.0 | 651.1 | |
| 0 | 6 | 0 | 3 | 12.09 | 303.18 | -16.41 | 52.68 | 0.3489 | -900.0 | -666.6 | |
| 0 | 7 | 0 | 3 | 9.03 | 311.41 | -8.18 | 41.63 | 0.2125 | 892.0 | 841.8 | |
| 0 | 13 | 0 | 7 | 8.87 | 311.73 | -7.86 | 41.03 | 0.2068 | 1319.0 | 1143.1 | |
| 0 | 4 | 0 | 2 | 11.41 | 304.51 | -15.08 | 52.04 | 0.3248 | 625.0 | 572.1 | |
| 0 | 10 | 0 | 5 | 11.39 | 303.55 | -16.04 | 53.76 | 0.3373 | -846.0 | -538.4 | |
| 0 | 6 | 0 | 3 | 8.68 | 310.49 | -9.10 | 45.82 | 0.2191 | 996.0 | 830.3 | |
| 0 | 3 | 0 | 1 | 9.34 | 308.49 | -11.10 | 49.30 | 0.2517 | 699.0 | 609.2 | |
| 0 | 3 | 0 | 2 | 10.81 | 304.35 | -15.24 | 53.84 | 0.3212 | -488.0 | -428.0 | |
| 0 | 2 | 0 | 1 | 10.68 | 304.14 | -15.45 | 54.53 | 0.3229 | -491.0 | -567.8 | |
| 0 | 5 | 0 | 3 | 9.47 | 307.35 | -12.24 | 51.61 | 0.2679 | 756.0 | 644.0 | |
| 0 | 4 | 0 | 2 | 10.43 | 304.27 | -15.32 | 54.97 | 0.3188 | -969.0 | -823.0 | |
| 21 | 512 | 11 | 272 | 11.48 | 301.22 | -18.37 | 57.05 | 0.3696 | -1714.0 | -743.0 | |
| 0 | 11 | 0 | 6 | 7.97 | 310.19 | -9.40 | 49.18 | 0.2148 | 893.0 | 657.2 | |
| 8 | -22 | 4 | -22 | 11.15 | 301.02 | -18.57 | 58.11 | 0.3696 | -1610.0 | 999999 | |
| 9 | -22 | 5 | -22 | 11.03 | 301.34 | -18.25 | 57.95 | 0.3643 | -1882.8 | 999999 | |
| 0 | 3 | 0 | 2 | 11.68 | 299.52 | -20.07 | 58.81 | 0.3946 | 158.0 | 75.8 | |
| 38 | -22 | 20 | -22 | 10.69 | 301.75 | -17.84 | 58.23 | 0.3558 | -2083.2 | 999999 | |
| 0 | 10 | 0 | 5 | 8.03 | 308.91 | -10.68 | 52.48 | 0.2324 | 878.0 | 559.3 | |
| 0 | 3 | 0 | 2 | 9.72 | 303.63 | -15.96 | 57.90 | 0.3213 | -795.0 | -606.0 | |
| 0 | 3 | 0 | 2 | 11.12 | 299.47 | -20.12 | 60.11 | 0.3911 | -743.0 | -635.1 | |
| 0 | 7 | 0 | 4 | 10.53 | 299.66 | -19.93 | 61.26 | 0.3838 | -884.0 | -753.2 | |
| 0 | 3 | 0 | 2 | 10.54 | 299.05 | -20.54 | 61.93 | 0.3927 | -570.0 | -553.2 | |
| 0 | 9 | 0 | 5 | 9.67 | 300.48 | -19.11 | 62.36 | 0.3660 | -828.0 | -658.9 | |
| 0 | 4 | 0 | 2 | 8.76 | 302.56 | -17.03 | 62.06 | 0.3291 | -672.0 | -655.1 | |
| Proj. U | - Projected umbra area in millionths of solar disc, negative values indicate | |
|
that the umbra consists of fragmented regions which cannot be separated without losing umbral area. In this way several spots (intensity minima in the umbra) have a common umbra, e.g. -2 means that the given spot shares an umbra with spot No.2, and the common U value is indicated at spot No.2. |
||
| Proj. WS | - Projected whole spot area in millionths of solar disc, negative values indicate | |
|
that several umbras have a common penumbra, e.g. -7 means that the given umbra shares a penumbra with umbra No.7, and the WS value is indicated at No.7. |
||
| Corr. U | - Corrected umbra area in millionths of solar hemisphere, for negative values see above | |
| Corr. WS | - Corrected whole spot area in millionths of solar hemisphere, for negative values see above | |
| B | - Heliographic latitude B; positive: North, negative: South | |
| L | - Heliographic longitude L | |
| LCM | - Longitudinal distance from the Sun's central meridian | |
| Pos. angle | - Position angle | |
| r | - Distance from the centre of Sun's disc in terms of Sun's radius | |
| MU | - Mean magnetic field within the umbra contour averaged the pixel values with sign. | |
| MP | - Mean magnetic field within the penumbra contour averaged the pixel values with sign. | |