SOHO MDI 1999-12-08 09:35:33 UT
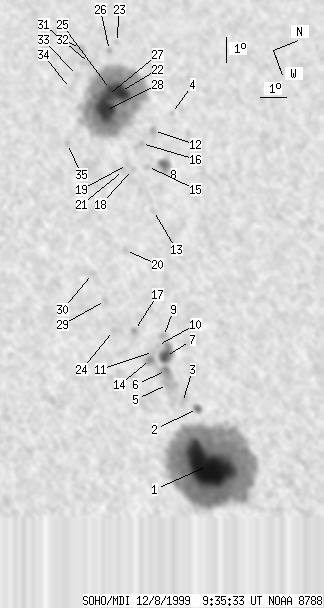
| group | Proj. U | Proj. WS | Corr. U | Corr. WS | B | L | LCM | Pos. angle | r | MU | MP |
| 251 | 1647 | 129 | 845 | 10.04 | 310.40 | -8.72 | 33.24 | 0.2446 | 710.2 | 189.0 | |
|
previous
or next observation for the same group /
back to the solar disc SOHO MDI 1999-12-08 09:35:33 UT |
| spot | Proj. U | Proj. WS | Corr. U | Corr. WS | B | L | LCM | Pos. angle | r | MU | MP |
| 151 | 896 | 76 | 450 | 9.48 | 316.40 | -2.72 | 15.76 | 0.1732 | 2207.7 | 703.6 | |
| 4 | 9 | 2 | 5 | 9.87 | 314.17 | -4.95 | 26.21 | 0.1933 | 1037.6 | 737.4 | |
| 0 | 10 | 0 | 5 | 9.41 | 313.75 | -5.37 | 29.26 | 0.1897 | 916.0 | 773.8 | |
| 0 | 4 | 0 | 2 | 13.03 | 302.72 | -16.40 | 50.52 | 0.3581 | -525.0 | -371.4 | |
| 0 | 23 | 0 | 12 | 9.12 | 312.90 | -6.23 | 33.85 | 0.1932 | 1182.0 | 1204.1 | |
| 3 | 25 | 1 | 12 | 9.27 | 312.37 | -6.75 | 35.56 | 0.2005 | 1256.2 | 1148.3 | |
| 11 | 31 | 6 | 16 | 9.43 | 311.84 | -7.28 | 37.14 | 0.2081 | 1449.5 | 868.0 | |
| 7 | 19 | 4 | 10 | 12.06 | 304.61 | -14.51 | 49.37 | 0.3243 | 1187.7 | 936.5 | |
| 0 | 6 | 0 | 3 | 9.64 | 311.08 | -8.04 | 39.29 | 0.2189 | 765.0 | 674.1 | |
| 0 | 2 | 0 | 1 | 9.29 | 311.33 | -7.79 | 39.43 | 0.2116 | 676.0 | 660.0 | |
| 0 | 2 | 0 | 1 | 9.07 | 311.50 | -7.62 | 39.52 | 0.2068 | 812.0 | 842.2 | |
| 0 | 5 | 0 | 3 | 12.14 | 303.16 | -15.96 | 51.82 | 0.3435 | -771.0 | -767.7 | |
| 0 | 5 | 0 | 3 | 11.02 | 306.24 | -12.89 | 48.70 | 0.2928 | -558.0 | -551.6 | |
| 0 | 16 | 0 | 8 | 8.85 | 311.75 | -7.37 | 39.26 | 0.2012 | 1377.0 | 1096.3 | |
| 0 | 4 | 0 | 2 | 11.42 | 304.48 | -14.64 | 51.22 | 0.3193 | 794.0 | 631.0 | |
| 0 | 9 | 0 | 5 | 11.52 | 303.52 | -15.60 | 52.69 | 0.3329 | -771.0 | -609.3 | |
| 0 | 6 | 0 | 3 | 8.67 | 310.48 | -8.65 | 44.36 | 0.2135 | 849.0 | 780.1 | |
| 0 | 3 | 0 | 2 | 10.83 | 304.41 | -14.72 | 52.85 | 0.3144 | -521.0 | -469.4 | |
| 0 | 2 | 0 | 1 | 10.71 | 304.15 | -14.97 | 53.60 | 0.3167 | -874.0 | -793.8 | |
| 0 | 5 | 0 | 2 | 9.45 | 307.39 | -11.74 | 50.50 | 0.2612 | 707.0 | 600.9 | |
| 0 | 2 | 0 | 1 | 10.49 | 304.33 | -14.79 | 53.88 | 0.3122 | -930.0 | -919.2 | |
| 21 | 517 | 11 | 274 | 11.48 | 301.24 | -17.89 | 56.38 | 0.3631 | -1740.1 | -759.3 | |
| 0 | 3 | 0 | 1 | 12.01 | 299.25 | -19.88 | 57.81 | 0.3947 | -612.0 | -525.1 | |
| 0 | 4 | 0 | 2 | 7.91 | 310.20 | -8.92 | 47.89 | 0.2080 | 761.0 | 650.9 | |
| 8 | -22 | 4 | -22 | 11.14 | 301.03 | -18.09 | 57.46 | 0.3630 | -1554.4 | 999999 | |
| 0 | 3 | 0 | 2 | 11.65 | 299.48 | -19.64 | 58.34 | 0.3885 | 222.0 | 130.2 | |
| 11 | -22 | 6 | -22 | 10.95 | 301.23 | -17.89 | 57.65 | 0.3586 | -1706.8 | 999999 | |
| 35 | -22 | 19 | -22 | 10.67 | 301.79 | -17.33 | 57.53 | 0.3485 | -2106.9 | 999999 | |
| 0 | 5 | 0 | 2 | 8.04 | 308.99 | -10.13 | 51.01 | 0.2252 | 876.0 | 705.9 | |
| 0 | 3 | 0 | 2 | 7.94 | 307.82 | -11.30 | 54.33 | 0.2401 | 549.0 | 629.4 | |
| 0 | 10 | 0 | 6 | 10.74 | 299.75 | -19.37 | 60.09 | 0.3776 | -895.0 | -710.8 | |
| 0 | 9 | 0 | 5 | 10.62 | 299.05 | -20.07 | 61.20 | 0.3867 | -547.0 | -532.7 | |
| 0 | 3 | 0 | 1 | 10.13 | 300.08 | -19.05 | 61.13 | 0.3685 | -548.0 | -524.6 | |
| 0 | 2 | 0 | 1 | 9.70 | 300.50 | -18.62 | 61.68 | 0.3592 | -817.0 | -721.6 | |
| 0 | 4 | 0 | 2 | 8.83 | 302.59 | -16.53 | 61.18 | 0.3224 | -971.0 | -754.6 | |
| Proj. U | - Projected umbra area in millionths of solar disc, negative values indicate | |
|
that the umbra consists of fragmented regions which cannot be separated without losing umbral area. In this way several spots (intensity minima in the umbra) have a common umbra, e.g. -2 means that the given spot shares an umbra with spot No.2, and the common U value is indicated at spot No.2. |
||
| Proj. WS | - Projected whole spot area in millionths of solar disc, negative values indicate | |
|
that several umbras have a common penumbra, e.g. -7 means that the given umbra shares a penumbra with umbra No.7, and the WS value is indicated at No.7. |
||
| Corr. U | - Corrected umbra area in millionths of solar hemisphere, for negative values see above | |
| Corr. WS | - Corrected whole spot area in millionths of solar hemisphere, for negative values see above | |
| B | - Heliographic latitude B; positive: North, negative: South | |
| L | - Heliographic longitude L | |
| LCM | - Longitudinal distance from the Sun's central meridian | |
| Pos. angle | - Position angle | |
| r | - Distance from the centre of Sun's disc in terms of Sun's radius | |
| MU | - Mean magnetic field within the umbra contour averaged the pixel values with sign. | |
| MP | - Mean magnetic field within the penumbra contour averaged the pixel values with sign. | |