SOHO MDI 1999-12-08 12:09:33 UT
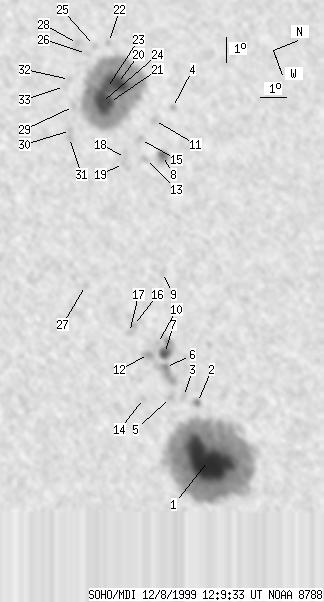
| group | Proj. U | Proj. WS | Corr. U | Corr. WS | B | L | LCM | Pos. angle | r | MU | MP |
| 247 | 1617 | 125 | 826 | 10.03 | 310.45 | -7.27 | 27.50 | 0.2332 | 627.4 | 195.5 | |
|
previous
or next observation for the same group /
back to the solar disc SOHO MDI 1999-12-08 12:09:33 UT |
| spot | Proj. U | Proj. WS | Corr. U | Corr. WS | B | L | LCM | Pos. angle | r | MU | MP |
| 145 | 871 | 73 | 437 | 9.49 | 316.45 | -1.26 | 7.43 | 0.1685 | 2239.8 | 732.2 | |
| 3 | 8 | 1 | 4 | 9.89 | 314.20 | -3.52 | 19.24 | 0.1844 | 984.9 | 832.8 | |
| 0 | 9 | 0 | 4 | 9.47 | 313.79 | -3.93 | 22.15 | 0.1800 | 1019.0 | 775.0 | |
| 0 | 4 | 0 | 2 | 13.09 | 302.82 | -14.90 | 47.69 | 0.3401 | -609.0 | -426.2 | |
| 0 | 6 | 0 | 3 | 8.98 | 313.65 | -4.06 | 23.95 | 0.1733 | 1118.0 | 930.4 | |
| 3 | 44 | 1 | 22 | 9.22 | 312.49 | -5.23 | 29.09 | 0.1858 | 1461.0 | 1085.2 | |
| 10 | 41 | 5 | 21 | 9.37 | 311.96 | -5.75 | 31.03 | 0.1927 | 1431.4 | 759.8 | |
| 5 | 17 | 3 | 9 | 12.05 | 304.54 | -13.17 | 46.66 | 0.3077 | 1278.2 | 1017.7 | |
| 0 | 8 | 0 | 4 | 10.42 | 308.95 | -8.76 | 39.41 | 0.2371 | -569.0 | -629.3 | |
| 0 | 5 | 0 | 3 | 9.26 | 311.50 | -6.21 | 33.33 | 0.1952 | 846.0 | 710.1 | |
| 0 | 4 | 0 | 2 | 12.25 | 303.10 | -14.61 | 49.10 | 0.3277 | -836.0 | -650.7 | |
| 0 | 10 | 0 | 5 | 8.78 | 311.79 | -5.93 | 33.51 | 0.1857 | 1262.0 | 1013.0 | |
| 0 | 7 | 0 | 4 | 11.38 | 304.48 | -13.23 | 48.47 | 0.3011 | 753.0 | 573.1 | |
| 0 | 3 | 0 | 2 | 7.99 | 313.32 | -4.39 | 28.35 | 0.1604 | 721.0 | 556.9 | |
| 0 | 7 | 0 | 4 | 11.47 | 303.66 | -14.06 | 49.92 | 0.3125 | -934.0 | -822.1 | |
| 0 | 4 | 0 | 2 | 8.64 | 310.53 | -7.19 | 39.20 | 0.1966 | 864.0 | 685.4 | |
| 0 | 5 | 0 | 3 | 8.40 | 310.73 | -6.98 | 39.20 | 0.1912 | 743.0 | 703.3 | |
| 0 | 10 | 0 | 5 | 10.68 | 304.16 | -13.56 | 50.98 | 0.2979 | -944.0 | -715.7 | |
| 0 | 9 | 0 | 4 | 10.52 | 304.36 | -13.36 | 50.98 | 0.2936 | -1014.0 | -817.4 | |
| 32 | 501 | 17 | 263 | 11.42 | 301.21 | -16.50 | 54.40 | 0.3440 | -1734.0 | -751.8 | |
| 10 | -20 | 5 | -20 | 10.86 | 301.85 | -15.87 | 54.74 | 0.3303 | -1968.6 | 999999 | |
| 0 | 4 | 0 | 2 | 11.66 | 299.50 | -18.22 | 56.39 | 0.3692 | 357.0 | 152.0 | |
| 10 | -20 | 5 | -20 | 10.95 | 301.27 | -16.44 | 55.46 | 0.3389 | -1753.9 | 999999 | |
| 29 | -20 | 15 | -20 | 10.57 | 301.75 | -15.97 | 55.65 | 0.3290 | -2163.8 | 999999 | |
| 0 | 4 | 0 | 2 | 11.11 | 299.45 | -18.27 | 57.76 | 0.3653 | -659.0 | -639.6 | |
| 0 | 4 | 0 | 2 | 10.70 | 299.66 | -18.05 | 58.43 | 0.3590 | -798.0 | -831.5 | |
| 0 | 5 | 0 | 3 | 7.46 | 308.42 | -9.29 | 50.64 | 0.2080 | 752.0 | 546.0 | |
| 0 | 8 | 0 | 4 | 10.52 | 299.16 | -18.56 | 59.56 | 0.3646 | -821.0 | -604.8 | |
| 0 | 5 | 0 | 2 | 9.50 | 301.55 | -16.16 | 58.78 | 0.3225 | -692.0 | -655.9 | |
| 0 | 3 | 0 | 2 | 9.06 | 302.43 | -15.28 | 58.61 | 0.3063 | -976.0 | -881.1 | |
| 0 | 5 | 0 | 3 | 8.92 | 302.69 | -15.03 | 58.57 | 0.3016 | -837.0 | -781.9 | |
| 0 | 4 | 0 | 2 | 9.73 | 300.46 | -17.25 | 59.77 | 0.3399 | -813.0 | -629.6 | |
| 0 | 2 | 0 | 1 | 9.45 | 300.67 | -17.05 | 60.21 | 0.3347 | -850.0 | -817.1 | |
| Proj. U | - Projected umbra area in millionths of solar disc, negative values indicate | |
|
that the umbra consists of fragmented regions which cannot be separated without losing umbral area. In this way several spots (intensity minima in the umbra) have a common umbra, e.g. -2 means that the given spot shares an umbra with spot No.2, and the common U value is indicated at spot No.2. |
||
| Proj. WS | - Projected whole spot area in millionths of solar disc, negative values indicate | |
|
that several umbras have a common penumbra, e.g. -7 means that the given umbra shares a penumbra with umbra No.7, and the WS value is indicated at No.7. |
||
| Corr. U | - Corrected umbra area in millionths of solar hemisphere, for negative values see above | |
| Corr. WS | - Corrected whole spot area in millionths of solar hemisphere, for negative values see above | |
| B | - Heliographic latitude B; positive: North, negative: South | |
| L | - Heliographic longitude L | |
| LCM | - Longitudinal distance from the Sun's central meridian | |
| Pos. angle | - Position angle | |
| r | - Distance from the centre of Sun's disc in terms of Sun's radius | |
| MU | - Mean magnetic field within the umbra contour averaged the pixel values with sign. | |
| MP | - Mean magnetic field within the penumbra contour averaged the pixel values with sign. | |