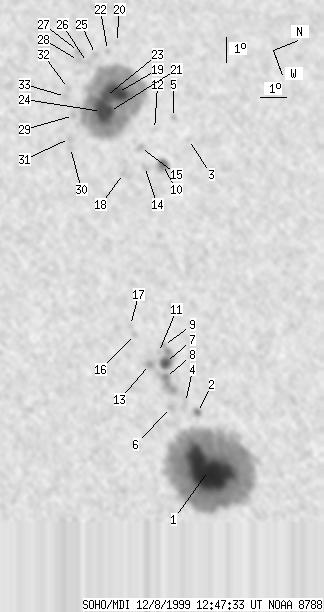
SOHO MDI 1999-12-08 12:47:33 UT
| group | Proj. U | Proj. WS | Corr. U | Corr. WS | B | L | LCM | Pos. angle | r | MU | MP |
| 252 | 1584 | 128 | 809 | 10.04 | 310.40 | -6.96 | 25.90 | 0.2320 | 651.9 | 177.3 | |
|
previous
or next observation for the same group /
back to the solar disc SOHO MDI 1999-12-08 12:47:33 UT |
| spot | Proj. U | Proj. WS | Corr. U | Corr. WS | B | L | LCM | Pos. angle | r | MU | MP |
| 150 | 872 | 75 | 438 | 9.47 | 316.47 | -0.90 | 5.31 | 0.1675 | 2213.8 | 721.8 | |
| 3 | 8 | 2 | 4 | 9.87 | 314.21 | -3.15 | 17.40 | 0.1821 | 954.5 | 834.8 | |
| 0 | 4 | 0 | 2 | 13.35 | 303.90 | -13.47 | 44.28 | 0.3260 | 321.0 | 221.5 | |
| 0 | 8 | 0 | 4 | 9.58 | 313.69 | -3.68 | 20.66 | 0.1803 | 757.0 | 799.9 | |
| 0 | 4 | 0 | 2 | 13.11 | 302.87 | -14.50 | 46.90 | 0.3355 | -609.0 | -426.2 | |
| 0 | 6 | 0 | 3 | 8.96 | 313.67 | -3.70 | 22.06 | 0.1706 | 1118.0 | 918.3 | |
| 11 | 32 | 5 | 16 | 9.40 | 311.96 | -5.41 | 29.42 | 0.1902 | 1374.2 | 792.6 | |
| 3 | 33 | 1 | 17 | 9.20 | 312.51 | -4.86 | 27.40 | 0.1826 | 1461.0 | 1174.8 | |
| 0 | 5 | 0 | 3 | 9.57 | 311.31 | -6.06 | 31.82 | 0.1983 | 593.0 | 556.4 | |
| 8 | 18 | 4 | 9 | 12.05 | 304.54 | -12.83 | 45.94 | 0.3036 | 1232.2 | 971.0 | |
| 0 | 2 | 0 | 1 | 9.29 | 311.50 | -5.87 | 31.77 | 0.1925 | 846.0 | 746.9 | |
| 0 | 3 | 0 | 2 | 12.24 | 303.10 | -14.27 | 48.45 | 0.3234 | -836.0 | -655.9 | |
| 0 | 8 | 0 | 4 | 8.80 | 311.82 | -5.55 | 31.74 | 0.1825 | 1262.0 | 1108.2 | |
| 0 | 7 | 0 | 3 | 11.36 | 304.39 | -12.98 | 47.97 | 0.2978 | 595.0 | 579.5 | |
| 0 | 7 | 0 | 4 | 11.48 | 303.61 | -13.75 | 49.29 | 0.3088 | -1013.0 | -826.5 | |
| 0 | 5 | 0 | 3 | 8.67 | 310.52 | -6.85 | 37.73 | 0.1934 | 864.0 | 645.0 | |
| 0 | 4 | 0 | 2 | 8.65 | 310.14 | -7.23 | 39.31 | 0.1973 | 532.0 | 495.5 | |
| 0 | 4 | 0 | 2 | 10.50 | 304.39 | -12.98 | 50.24 | 0.2886 | -1014.0 | -927.5 | |
| 30 | 505 | 16 | 265 | 11.41 | 301.21 | -16.16 | 53.85 | 0.3393 | -1739.9 | -752.4 | |
| 0 | 3 | 0 | 2 | 12.07 | 299.24 | -18.13 | 55.31 | 0.3716 | -659.0 | -505.6 | |
| 9 | -19 | 5 | -19 | 10.85 | 301.84 | -15.52 | 54.17 | 0.3257 | -2014.2 | 999999 | |
| 0 | 3 | 0 | 2 | 11.63 | 299.45 | -17.92 | 56.03 | 0.3650 | 357.0 | 174.9 | |
| 12 | -19 | 6 | -19 | 10.92 | 301.22 | -16.15 | 55.06 | 0.3347 | -1681.0 | 999999 | |
| 26 | -19 | 14 | -19 | 10.56 | 301.74 | -15.62 | 55.09 | 0.3243 | -2163.2 | 999999 | |
| 0 | 4 | 0 | 2 | 11.14 | 299.46 | -17.91 | 57.18 | 0.3606 | -659.0 | -634.4 | |
| 0 | 5 | 0 | 2 | 10.74 | 299.67 | -17.70 | 57.85 | 0.3543 | -798.0 | -820.3 | |
| 0 | 4 | 0 | 2 | 10.56 | 299.13 | -18.24 | 59.02 | 0.3604 | -575.0 | -592.5 | |
| 0 | 4 | 0 | 2 | 10.44 | 299.48 | -17.89 | 58.85 | 0.3545 | -900.0 | -786.9 | |
| 0 | 5 | 0 | 3 | 9.49 | 301.55 | -15.82 | 58.26 | 0.3176 | -692.0 | -666.3 | |
| 0 | 5 | 0 | 3 | 8.94 | 302.73 | -14.64 | 57.86 | 0.2962 | -893.0 | -721.5 | |
| 0 | 7 | 0 | 3 | 9.03 | 302.37 | -14.99 | 58.21 | 0.3020 | -762.0 | -771.0 | |
| 0 | 4 | 0 | 2 | 9.68 | 300.44 | -16.92 | 59.40 | 0.3349 | -813.0 | -633.3 | |
| 0 | 5 | 0 | 2 | 9.46 | 300.71 | -16.65 | 59.59 | 0.3292 | -850.0 | -789.5 | |
| Proj. U | - Projected umbra area in millionths of solar disc, negative values indicate | |
|
that the umbra consists of fragmented regions which cannot be separated without losing umbral area. In this way several spots (intensity minima in the umbra) have a common umbra, e.g. -2 means that the given spot shares an umbra with spot No.2, and the common U value is indicated at spot No.2. |
||
| Proj. WS | - Projected whole spot area in millionths of solar disc, negative values indicate | |
|
that several umbras have a common penumbra, e.g. -7 means that the given umbra shares a penumbra with umbra No.7, and the WS value is indicated at No.7. |
||
| Corr. U | - Corrected umbra area in millionths of solar hemisphere, for negative values see above | |
| Corr. WS | - Corrected whole spot area in millionths of solar hemisphere, for negative values see above | |
| B | - Heliographic latitude B; positive: North, negative: South | |
| L | - Heliographic longitude L | |
| LCM | - Longitudinal distance from the Sun's central meridian | |
| Pos. angle | - Position angle | |
| r | - Distance from the centre of Sun's disc in terms of Sun's radius | |
| MU | - Mean magnetic field within the umbra contour averaged the pixel values with sign. | |
| MP | - Mean magnetic field within the penumbra contour averaged the pixel values with sign. | |