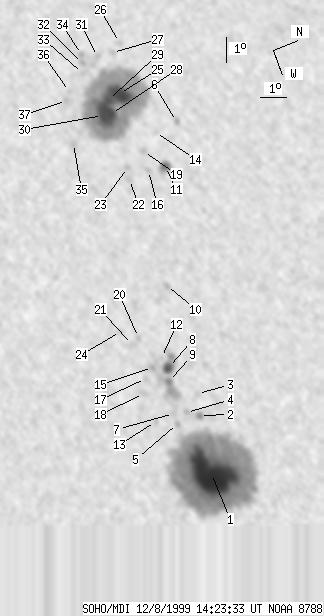
SOHO MDI 1999-12-08 14:23:33 UT
| group | Proj. U | Proj. WS | Corr. U | Corr. WS | B | L | LCM | Pos. angle | r | MU | MP |
| 258 | 1620 | 132 | 823 | 10.05 | 310.26 | -6.23 | 22.83 | 0.2277 | 558.2 | 195.2 | |
|
previous
or next observation for the same group /
back to the solar disc SOHO MDI 1999-12-08 14:23:33 UT |
| spot | Proj. U | Proj. WS | Corr. U | Corr. WS | B | L | LCM | Pos. angle | r | MU | MP |
| 148 | 847 | 75 | 425 | 9.48 | 316.46 | -0.03 | 0.16 | 0.1672 | 2185.4 | 735.4 | |
| 2 | 7 | 1 | 4 | 9.85 | 314.19 | -2.30 | 12.87 | 0.1780 | 1130.1 | 784.8 | |
| 0 | 5 | 0 | 2 | 10.08 | 313.36 | -3.12 | 16.89 | 0.1856 | 712.0 | 523.8 | |
| 0 | 5 | 0 | 3 | 9.42 | 313.91 | -2.58 | 15.04 | 0.1720 | 1119.0 | 975.3 | |
| 0 | 4 | 0 | 2 | 8.94 | 314.18 | -2.30 | 14.19 | 0.1628 | 918.0 | 706.0 | |
| 0 | 5 | 0 | 2 | 13.11 | 302.93 | -13.55 | 44.98 | 0.3244 | -501.0 | -337.4 | |
| 0 | 11 | 0 | 6 | 8.94 | 313.77 | -2.72 | 16.63 | 0.1646 | 1007.0 | 867.1 | |
| 7 | 34 | 3 | 17 | 9.39 | 312.03 | -4.46 | 24.97 | 0.1827 | 1345.1 | 845.8 | |
| 4 | 41 | 2 | 21 | 9.20 | 312.54 | -3.95 | 22.84 | 0.1761 | 1340.3 | 1114.6 | |
| 0 | 5 | 0 | 2 | 10.46 | 308.99 | -7.50 | 35.03 | 0.2247 | -876.0 | -741.4 | |
| 8 | 18 | 4 | 9 | 12.08 | 304.52 | -11.97 | 43.89 | 0.2939 | 1241.3 | 944.4 | |
| 0 | 2 | 0 | 1 | 9.28 | 311.57 | -4.92 | 27.47 | 0.1844 | 707.0 | 655.5 | |
| 0 | 3 | 0 | 2 | 8.18 | 313.81 | -2.68 | 17.80 | 0.1518 | -256.0 | -165.7 | |
| 0 | 3 | 0 | 2 | 12.19 | 303.10 | -13.39 | 46.79 | 0.3121 | -659.0 | -453.1 | |
| 0 | 9 | 0 | 4 | 8.81 | 311.81 | -4.68 | 27.49 | 0.1754 | 1231.0 | 1038.4 | |
| 0 | 4 | 0 | 2 | 11.40 | 304.46 | -12.03 | 45.72 | 0.2868 | 741.0 | 701.1 | |
| 0 | 5 | 0 | 3 | 8.41 | 312.12 | -4.37 | 27.01 | 0.1668 | 792.0 | 654.9 | |
| 0 | 5 | 0 | 2 | 8.13 | 312.64 | -3.85 | 24.93 | 0.1585 | 666.0 | 554.4 | |
| 0 | 5 | 0 | 2 | 11.48 | 303.67 | -12.82 | 47.29 | 0.2972 | -905.0 | -745.9 | |
| 0 | 4 | 0 | 2 | 8.72 | 310.53 | -5.96 | 33.80 | 0.1853 | 866.0 | 707.3 | |
| 0 | 7 | 0 | 3 | 8.41 | 310.71 | -5.78 | 33.98 | 0.1792 | 595.0 | 718.3 | |
| 0 | 8 | 0 | 4 | 10.58 | 304.55 | -11.93 | 47.65 | 0.2763 | -831.0 | -730.4 | |
| 0 | 5 | 0 | 3 | 10.68 | 304.08 | -12.41 | 48.50 | 0.2833 | -775.0 | -738.9 | |
| 0 | 7 | 0 | 3 | 8.15 | 310.07 | -6.42 | 37.63 | 0.1820 | 852.0 | 691.0 | |
| 36 | 521 | 19 | 272 | 11.42 | 301.15 | -15.34 | 52.42 | 0.3287 | -1660.6 | -718.3 | |
| 0 | 4 | 0 | 2 | 12.13 | 299.17 | -17.32 | 53.98 | 0.3615 | -667.0 | -513.3 | |
| 0 | 6 | 0 | 3 | 11.73 | 299.47 | -17.02 | 54.43 | 0.3539 | 354.0 | 182.6 | |
| 40 | -25 | 21 | -25 | 10.85 | 301.82 | -14.67 | 52.66 | 0.3143 | -2088.2 | 999999 | |
| 13 | -25 | 7 | -25 | 10.93 | 301.24 | -15.24 | 53.47 | 0.3227 | -1717.2 | 999999 | |
| -28 | -25 | -28 | -25 | 10.49 | 301.78 | -14.71 | 53.65 | 0.3113 | 999999 | 999999 | |
| 0 | 14 | 0 | 7 | 11.13 | 299.44 | -17.04 | 55.91 | 0.3488 | -667.0 | -719.0 | |
| 0 | 4 | 0 | 2 | 10.49 | 299.53 | -16.96 | 57.37 | 0.3421 | -714.0 | -768.1 | |
| 0 | 6 | 0 | 3 | 10.35 | 299.92 | -16.57 | 57.14 | 0.3355 | -509.0 | -443.7 | |
| 0 | 4 | 0 | 2 | 10.58 | 299.17 | -17.32 | 57.68 | 0.3479 | -769.0 | -623.0 | |
| 0 | 5 | 0 | 3 | 9.05 | 302.48 | -14.01 | 56.38 | 0.2884 | -659.0 | -707.6 | |
| 0 | 2 | 0 | 1 | 9.63 | 300.45 | -16.04 | 58.21 | 0.3220 | -742.0 | -700.5 | |
| 0 | 5 | 0 | 2 | 9.39 | 300.76 | -15.73 | 58.37 | 0.3157 | -1007.0 | -857.5 | |
| Proj. U | - Projected umbra area in millionths of solar disc, negative values indicate | |
|
that the umbra consists of fragmented regions which cannot be separated without losing umbral area. In this way several spots (intensity minima in the umbra) have a common umbra, e.g. -2 means that the given spot shares an umbra with spot No.2, and the common U value is indicated at spot No.2. |
||
| Proj. WS | - Projected whole spot area in millionths of solar disc, negative values indicate | |
|
that several umbras have a common penumbra, e.g. -7 means that the given umbra shares a penumbra with umbra No.7, and the WS value is indicated at No.7. |
||
| Corr. U | - Corrected umbra area in millionths of solar hemisphere, for negative values see above | |
| Corr. WS | - Corrected whole spot area in millionths of solar hemisphere, for negative values see above | |
| B | - Heliographic latitude B; positive: North, negative: South | |
| L | - Heliographic longitude L | |
| LCM | - Longitudinal distance from the Sun's central meridian | |
| Pos. angle | - Position angle | |
| r | - Distance from the centre of Sun's disc in terms of Sun's radius | |
| MU | - Mean magnetic field within the umbra contour averaged the pixel values with sign. | |
| MP | - Mean magnetic field within the penumbra contour averaged the pixel values with sign. | |