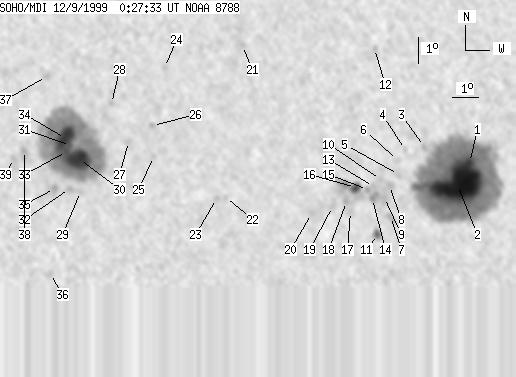
SOHO MDI 1999-12-09 00:27:33 UT
| group | Proj. U | Proj. WS | Corr. U | Corr. WS | B | L | LCM | Pos. angle | r | MU | MP |
| 231 | 1632 | 117 | 829 | 9.92 | 310.40 | -0.56 | 230.48 | 0.2120 | 534.0 | 212.1 | |
|
previous
or next observation for the same group /
back to the solar disc SOHO MDI 1999-12-09 00:27:33 UT |
| spot | Proj. U | Proj. WS | Corr. U | Corr. WS | B | L | LCM | Pos. angle | r | MU | MP |
| 6 | 864 | 3 | 436 | 10.29 | 316.86 | 5.90 | 330.84 | 0.2084 | 1619.2 | 762.7 | |
| 132 | -1 | 66 | -1 | 9.43 | 316.38 | 5.41 | 330.79 | 0.1916 | 2235.6 | 999999 | |
| 0 | 4 | 0 | 2 | 10.91 | 315.11 | 4.15 | 339.68 | 0.2055 | -200.0 | -30.8 | |
| 0 | 4 | 0 | 2 | 10.79 | 314.37 | 3.41 | 342.91 | 0.1995 | 533.0 | 489.0 | |
| 0 | 3 | 0 | 2 | 9.82 | 314.09 | 3.12 | 342.77 | 0.1821 | 566.0 | 579.9 | |
| 0 | 3 | 0 | 2 | 10.36 | 314.05 | 3.09 | 343.80 | 0.1909 | 594.0 | 543.1 | |
| 0 | 8 | 0 | 4 | 8.19 | 313.76 | 2.80 | 341.57 | 0.1537 | 712.0 | 577.4 | |
| 0 | 5 | 0 | 3 | 9.39 | 313.73 | 2.77 | 343.95 | 0.1733 | 1062.0 | 970.1 | |
| 0 | 10 | 0 | 5 | 8.93 | 313.54 | 2.57 | 344.30 | 0.1647 | 1128.0 | 998.0 | |
| 0 | 4 | 0 | 2 | 9.62 | 313.39 | 2.42 | 346.21 | 0.1756 | 557.0 | 719.5 | |
| 5 | 12 | 2 | 6 | 7.50 | 313.26 | 2.29 | 343.40 | 0.1395 | -951.8 | -477.5 | |
| 0 | 5 | 0 | 2 | 14.75 | 313.20 | 2.23 | 351.67 | 0.2612 | 382.0 | 577.9 | |
| 0 | 3 | 0 | 1 | 9.35 | 313.11 | 2.15 | 347.37 | 0.1700 | 997.0 | 874.1 | |
| 0 | 11 | 0 | 6 | 8.89 | 313.07 | 2.11 | 346.98 | 0.1620 | 1311.0 | 1286.3 | |
| 0 | 3 | 0 | 2 | 9.24 | 312.88 | 1.92 | 348.56 | 0.1672 | 1273.0 | 1126.1 | |
| 8 | 47 | 4 | 23 | 9.31 | 312.42 | 1.45 | 351.36 | 0.1671 | 1267.6 | 930.5 | |
| 0 | 6 | 0 | 3 | 8.39 | 312.22 | 1.25 | 351.70 | 0.1507 | 693.0 | 614.8 | |
| 0 | 8 | 0 | 4 | 8.77 | 312.07 | 1.10 | 353.02 | 0.1570 | 937.0 | 888.4 | |
| 0 | 12 | 0 | 6 | 8.58 | 311.52 | 0.56 | 356.36 | 0.1528 | 801.0 | 685.3 | |
| 0 | 3 | 0 | 2 | 8.31 | 310.71 | -0.25 | 1.70 | 0.1479 | 647.0 | 775.5 | |
| 0 | 7 | 0 | 4 | 14.87 | 307.97 | -2.99 | 11.00 | 0.2653 | 415.0 | 435.2 | |
| 0 | 2 | 0 | 1 | 8.93 | 307.38 | -3.58 | 21.37 | 0.1702 | 487.0 | 453.6 | |
| 0 | 4 | 0 | 2 | 8.89 | 307.03 | -3.93 | 23.33 | 0.1719 | 833.0 | 740.7 | |
| 0 | 3 | 0 | 2 | 14.00 | 304.90 | -6.06 | 22.73 | 0.2664 | -744.0 | -672.7 | |
| 0 | 3 | 0 | 1 | 10.52 | 304.55 | -6.41 | 30.67 | 0.2163 | -662.0 | -595.6 | |
| 0 | 4 | 0 | 2 | 11.73 | 304.49 | -6.48 | 28.22 | 0.2347 | 844.0 | 663.6 | |
| 0 | 5 | 0 | 3 | 11.10 | 303.56 | -7.41 | 32.95 | 0.2336 | -237.0 | -241.3 | |
| 0 | 4 | 0 | 2 | 12.59 | 302.85 | -8.12 | 32.01 | 0.2612 | -618.0 | -534.7 | |
| 0 | 5 | 0 | 3 | 9.16 | 301.73 | -9.24 | 44.41 | 0.2275 | -755.0 | -536.4 | |
| 44 | 532 | 23 | 272 | 10.40 | 301.65 | -9.31 | 40.99 | 0.2438 | -2123.2 | -718.0 | |
| 3 | -30 | 2 | -30 | 10.95 | 301.28 | -9.69 | 40.63 | 0.2548 | -1757.9 | 999999 | |
| 0 | 6 | 0 | 3 | 9.28 | 301.29 | -9.67 | 45.36 | 0.2342 | -759.0 | -782.5 | |
| 4 | -30 | 2 | -30 | 10.72 | 301.13 | -9.84 | 41.69 | 0.2536 | -1889.1 | 999999 | |
| 29 | -30 | 15 | -30 | 11.22 | 301.07 | -9.89 | 40.52 | 0.2606 | -1820.2 | 999999 | |
| 0 | 8 | 0 | 4 | 9.28 | 300.70 | -10.26 | 47.03 | 0.2414 | -1169.0 | -956.5 | |
| 0 | 9 | 0 | 4 | 6.00 | 300.62 | -10.34 | 59.05 | 0.2091 | -466.0 | -389.0 | |
| 0 | 6 | 0 | 3 | 13.65 | 300.22 | -10.75 | 37.22 | 0.3009 | -859.0 | -679.2 | |
| 0 | 12 | 0 | 6 | 10.76 | 299.46 | -11.50 | 46.00 | 0.2736 | -869.0 | -651.3 | |
| 0 | 7 | 0 | 4 | 10.44 | 299.04 | -11.93 | 47.87 | 0.2753 | -544.0 | -510.2 | |
| Proj. U | - Projected umbra area in millionths of solar disc, negative values indicate | |
|
that the umbra consists of fragmented regions which cannot be separated without losing umbral area. In this way several spots (intensity minima in the umbra) have a common umbra, e.g. -2 means that the given spot shares an umbra with spot No.2, and the common U value is indicated at spot No.2. |
||
| Proj. WS | - Projected whole spot area in millionths of solar disc, negative values indicate | |
|
that several umbras have a common penumbra, e.g. -7 means that the given umbra shares a penumbra with umbra No.7, and the WS value is indicated at No.7. |
||
| Corr. U | - Corrected umbra area in millionths of solar hemisphere, for negative values see above | |
| Corr. WS | - Corrected whole spot area in millionths of solar hemisphere, for negative values see above | |
| B | - Heliographic latitude B; positive: North, negative: South | |
| L | - Heliographic longitude L | |
| LCM | - Longitudinal distance from the Sun's central meridian | |
| Pos. angle | - Position angle | |
| r | - Distance from the centre of Sun's disc in terms of Sun's radius | |
| MU | - Mean magnetic field within the umbra contour averaged the pixel values with sign. | |
| MP | - Mean magnetic field within the penumbra contour averaged the pixel values with sign. | |