SOHO MDI 1999-12-09 07:59:33 UT
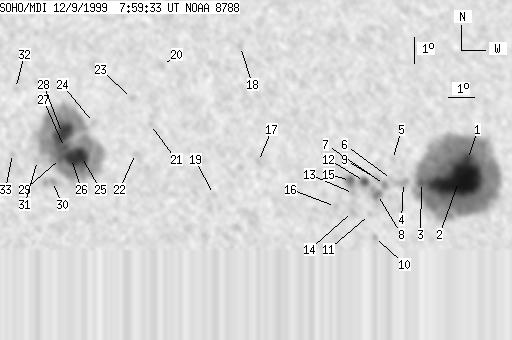
| group | Proj. U | Proj. WS | Corr. U | Corr. WS | B | L | LCM | Pos. angle | r | MU | MP |
| 248 | 1555 | 127 | 793 | 9.99 | 310.64 | 3.81 | 342.40 | 0.2252 | 634.9 | 195.3 | |
|
previous
or next observation for the same group /
back to the solar disc SOHO MDI 1999-12-09 07:59:33 UT |
| spot | Proj. U | Proj. WS | Corr. U | Corr. WS | B | L | LCM | Pos. angle | r | MU | MP |
| 9 | 852 | 5 | 434 | 10.32 | 316.89 | 10.06 | 316.72 | 0.2517 | 1545.5 | 734.1 | |
| 134 | -1 | 69 | -1 | 9.47 | 316.50 | 9.67 | 315.34 | 0.2369 | 2134.1 | 999999 | |
| 7 | -1 | 3 | -1 | 9.43 | 315.05 | 8.22 | 319.82 | 0.2197 | 1427.7 | 999999 | |
| 0 | 13 | 0 | 7 | 9.43 | 314.35 | 7.52 | 322.31 | 0.2121 | 1181.0 | 1029.4 | |
| 0 | 5 | 0 | 3 | 10.32 | 313.94 | 7.11 | 326.29 | 0.2203 | 574.0 | 464.5 | |
| 0 | 2 | 0 | 1 | 9.54 | 313.88 | 7.05 | 324.40 | 0.2089 | 934.0 | 876.6 | |
| 0 | 7 | 0 | 4 | 9.35 | 313.60 | 6.77 | 324.92 | 0.2035 | 1312.0 | 1113.8 | |
| 4 | 30 | 2 | 15 | 8.96 | 313.32 | 6.49 | 324.92 | 0.1953 | 1383.6 | 1014.1 | |
| 0 | 8 | 0 | 4 | 9.54 | 313.33 | 6.50 | 326.55 | 0.2036 | 1098.0 | 892.9 | |
| 0 | 4 | 0 | 2 | 7.30 | 313.18 | 6.35 | 319.92 | 0.1712 | -762.0 | -523.8 | |
| 0 | 5 | 0 | 3 | 8.19 | 313.00 | 6.17 | 323.87 | 0.1813 | 837.0 | 594.2 | |
| 6 | 13 | 3 | 7 | 9.47 | 312.83 | 6.00 | 328.44 | 0.1978 | 1422.9 | 1033.4 | |
| 0 | 7 | 0 | 4 | 9.00 | 312.39 | 5.56 | 329.07 | 0.1871 | 958.0 | 805.6 | |
| 0 | 7 | 0 | 4 | 8.30 | 312.34 | 5.51 | 327.25 | 0.1765 | 1066.0 | 852.3 | |
| 6 | 15 | 3 | 7 | 9.51 | 312.28 | 5.45 | 330.91 | 0.1936 | 1302.5 | 1144.7 | |
| 0 | 5 | 0 | 3 | 8.50 | 311.68 | 4.85 | 331.01 | 0.1735 | 875.0 | 853.2 | |
| 0 | 3 | 0 | 2 | 10.24 | 308.71 | 1.88 | 349.88 | 0.1848 | -846.0 | -707.3 | |
| 0 | 5 | 0 | 3 | 14.75 | 308.03 | 1.20 | 355.50 | 0.2598 | 684.0 | 509.1 | |
| 0 | 4 | 0 | 2 | 8.96 | 306.96 | 0.13 | 359.18 | 0.1598 | 800.0 | 631.5 | |
| 0 | 7 | 0 | 3 | 14.00 | 304.96 | -1.87 | 7.38 | 0.2483 | -549.0 | -541.8 | |
| 0 | 4 | 0 | 2 | 11.68 | 304.50 | -2.33 | 10.93 | 0.2106 | 607.0 | 452.4 | |
| 0 | 3 | 0 | 1 | 10.55 | 303.93 | -2.90 | 14.94 | 0.1939 | -593.0 | -556.2 | |
| 0 | 6 | 0 | 3 | 12.70 | 303.75 | -3.08 | 13.22 | 0.2303 | -699.0 | -610.2 | |
| 0 | 7 | 0 | 3 | 11.76 | 302.27 | -4.56 | 20.58 | 0.2223 | -298.0 | -258.8 | |
| 21 | 509 | 11 | 258 | 10.44 | 301.83 | -5.00 | 24.95 | 0.2043 | -2009.8 | -757.3 | |
| 18 | -25 | 9 | -25 | 10.36 | 301.44 | -5.39 | 26.79 | 0.2061 | -2192.2 | 999999 | |
| 2 | -25 | 1 | -25 | 10.79 | 301.16 | -5.67 | 27.02 | 0.2148 | -1986.9 | 999999 | |
| 35 | -25 | 18 | -25 | 11.33 | 301.07 | -5.76 | 26.24 | 0.2238 | -1755.9 | 999999 | |
| 6 | -25 | 3 | -25 | 10.36 | 301.01 | -5.82 | 28.59 | 0.2095 | -1322.5 | 999999 | |
| 0 | 21 | 0 | 11 | 9.47 | 300.71 | -6.12 | 32.08 | 0.1989 | -1242.0 | -945.9 | |
| 0 | 6 | 0 | 3 | 10.28 | 300.11 | -6.72 | 32.36 | 0.2162 | -849.0 | -537.0 | |
| 0 | 4 | 0 | 2 | 13.10 | 299.17 | -7.66 | 29.46 | 0.2652 | -512.0 | -489.5 | |
| 0 | 3 | 0 | 2 | 10.56 | 299.12 | -7.71 | 35.27 | 0.2294 | -778.0 | -631.9 | |
| Proj. U | - Projected umbra area in millionths of solar disc, negative values indicate | |
|
that the umbra consists of fragmented regions which cannot be separated without losing umbral area. In this way several spots (intensity minima in the umbra) have a common umbra, e.g. -2 means that the given spot shares an umbra with spot No.2, and the common U value is indicated at spot No.2. |
||
| Proj. WS | - Projected whole spot area in millionths of solar disc, negative values indicate | |
|
that several umbras have a common penumbra, e.g. -7 means that the given umbra shares a penumbra with umbra No.7, and the WS value is indicated at No.7. |
||
| Corr. U | - Corrected umbra area in millionths of solar hemisphere, for negative values see above | |
| Corr. WS | - Corrected whole spot area in millionths of solar hemisphere, for negative values see above | |
| B | - Heliographic latitude B; positive: North, negative: South | |
| L | - Heliographic longitude L | |
| LCM | - Longitudinal distance from the Sun's central meridian | |
| Pos. angle | - Position angle | |
| r | - Distance from the centre of Sun's disc in terms of Sun's radius | |
| MU | - Mean magnetic field within the umbra contour averaged the pixel values with sign. | |
| MP | - Mean magnetic field within the penumbra contour averaged the pixel values with sign. | |