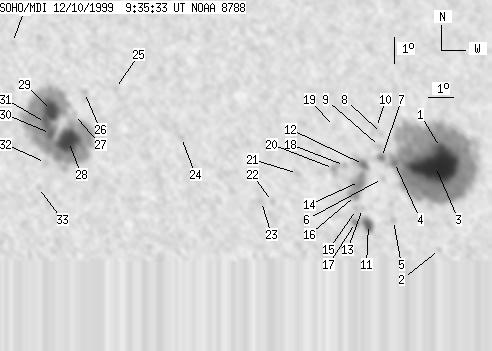
SOHO MDI 1999-12-10 09:35:33 UT
| group | Proj. U | Proj. WS | Corr. U | Corr. WS | B | L | LCM | Pos. angle | r | MU | MP |
| 255 | 1568 | 135 | 839 | 9.82 | 311.46 | 18.68 | 302.54 | 0.3694 | 415.8 | 200.2 | |
|
previous
or next observation for the same group /
back to the solar disc SOHO MDI 1999-12-10 09:35:33 UT |
| spot | Proj. U | Proj. WS | Corr. U | Corr. WS | B | L | LCM | Pos. angle | r | MU | MP |
| 6 | 847 | 3 | 466 | 10.16 | 317.18 | 24.40 | 294.05 | 0.4472 | 1323.0 | 689.7 | |
| 0 | 3 | 0 | 2 | 6.21 | 316.88 | 24.10 | 285.61 | 0.4234 | -614.0 | -380.0 | |
| 125 | -1 | 69 | -1 | 9.42 | 316.91 | 24.13 | 292.71 | 0.4391 | 1823.8 | 999999 | |
| 3 | -1 | 2 | -1 | 9.57 | 315.19 | 22.41 | 294.52 | 0.4150 | 1443.9 | 999999 | |
| 0 | 5 | 0 | 3 | 7.33 | 315.01 | 22.23 | 289.48 | 0.3998 | 531.0 | 440.2 | |
| 0 | 5 | 0 | 3 | 8.95 | 314.65 | 21.87 | 293.61 | 0.4033 | 804.0 | 637.1 | |
| 3 | -1 | 1 | -1 | 9.77 | 314.66 | 21.88 | 295.46 | 0.4085 | 891.9 | 999999 | |
| 0 | 3 | 0 | 1 | 10.70 | 314.73 | 21.95 | 297.46 | 0.4157 | 507.0 | 397.5 | |
| 0 | 5 | 0 | 3 | 10.19 | 314.61 | 21.83 | 296.47 | 0.4105 | 521.0 | 279.3 | |
| 0 | 5 | 0 | 3 | 10.93 | 314.54 | 21.76 | 298.16 | 0.4146 | -221.0 | -214.7 | |
| 10 | 31 | 5 | 17 | 7.17 | 313.97 | 21.19 | 289.94 | 0.3831 | 802.2 | 8.6 | |
| 6 | 75 | 3 | 40 | 9.49 | 313.89 | 21.11 | 295.59 | 0.3956 | 1278.8 | 804.8 | |
| 0 | 3 | 0 | 2 | 7.79 | 313.75 | 20.97 | 291.66 | 0.3832 | -536.0 | -425.1 | |
| 10 | -12 | 5 | -12 | 8.83 | 313.68 | 20.90 | 294.25 | 0.3884 | 1026.6 | 999999 | |
| 0 | 6 | 0 | 3 | 7.75 | 313.50 | 20.72 | 291.79 | 0.3792 | -606.0 | -604.7 | |
| 2 | -12 | 1 | -12 | 8.29 | 313.49 | 20.71 | 293.13 | 0.3822 | -29.8 | 999999 | |
| 2 | -11 | 1 | -11 | 7.25 | 313.43 | 20.65 | 290.59 | 0.3754 | -769.0 | 999999 | |
| 0 | 5 | 0 | 3 | 9.45 | 313.10 | 20.32 | 296.32 | 0.3839 | 1037.0 | 820.0 | |
| 0 | 3 | 0 | 1 | 10.97 | 312.79 | 20.01 | 300.20 | 0.3903 | 299.0 | 383.2 | |
| 0 | 14 | 0 | 7 | 9.33 | 312.64 | 19.86 | 296.55 | 0.3764 | 1102.0 | 984.7 | |
| 0 | 6 | 0 | 3 | 9.14 | 311.15 | 18.37 | 297.81 | 0.3534 | 792.0 | 709.3 | |
| 0 | 4 | 0 | 2 | 8.05 | 310.08 | 17.30 | 296.28 | 0.3299 | 880.0 | 651.3 | |
| 0 | 3 | 0 | 2 | 8.05 | 309.64 | 16.86 | 296.86 | 0.3233 | 945.0 | 812.0 | |
| 0 | 3 | 0 | 2 | 10.53 | 306.53 | 13.75 | 308.83 | 0.3014 | -784.0 | -730.8 | |
| 0 | 2 | 0 | 1 | 12.44 | 303.98 | 11.20 | 319.34 | 0.2924 | 713.0 | 553.4 | |
| 0 | 5 | 0 | 3 | 12.28 | 302.74 | 9.96 | 322.24 | 0.2772 | -472.0 | -513.6 | |
| 0 | 3 | 0 | 1 | 11.42 | 302.31 | 9.53 | 321.42 | 0.2615 | -570.0 | -475.5 | |
| 43 | 518 | 22 | 265 | 10.37 | 302.04 | 9.26 | 319.51 | 0.2450 | -1927.2 | -736.0 | |
| 25 | -28 | 13 | -28 | 11.57 | 301.41 | 8.63 | 324.51 | 0.2543 | -1699.1 | 999999 | |
| 8 | -28 | 4 | -28 | 10.68 | 301.34 | 8.56 | 322.52 | 0.2415 | -1878.1 | 999999 | |
| 12 | -28 | 6 | -28 | 11.10 | 301.16 | 8.38 | 324.19 | 0.2455 | -1822.8 | 999999 | |
| 0 | 6 | 0 | 3 | 9.55 | 301.12 | 8.34 | 320.17 | 0.2243 | -721.0 | -630.4 | |
| 0 | 5 | 0 | 2 | 8.58 | 300.82 | 8.04 | 318.21 | 0.2085 | -866.0 | -598.6 | |
| 0 | 3 | 0 | 1 | 14.24 | 299.95 | 7.17 | 334.32 | 0.2804 | -719.0 | -738.7 | |
| Proj. U | - Projected umbra area in millionths of solar disc, negative values indicate | |
|
that the umbra consists of fragmented regions which cannot be separated without losing umbral area. In this way several spots (intensity minima in the umbra) have a common umbra, e.g. -2 means that the given spot shares an umbra with spot No.2, and the common U value is indicated at spot No.2. |
||
| Proj. WS | - Projected whole spot area in millionths of solar disc, negative values indicate | |
|
that several umbras have a common penumbra, e.g. -7 means that the given umbra shares a penumbra with umbra No.7, and the WS value is indicated at No.7. |
||
| Corr. U | - Corrected umbra area in millionths of solar hemisphere, for negative values see above | |
| Corr. WS | - Corrected whole spot area in millionths of solar hemisphere, for negative values see above | |
| B | - Heliographic latitude B; positive: North, negative: South | |
| L | - Heliographic longitude L | |
| LCM | - Longitudinal distance from the Sun's central meridian | |
| Pos. angle | - Position angle | |
| r | - Distance from the centre of Sun's disc in terms of Sun's radius | |
| MU | - Mean magnetic field within the umbra contour averaged the pixel values with sign. | |
| MP | - Mean magnetic field within the penumbra contour averaged the pixel values with sign. | |