SOHO MDI 1999-12-10 11:11:33 UT
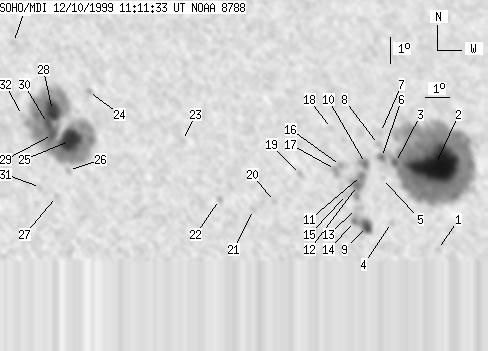
| group | Proj. U | Proj. WS | Corr. U | Corr. WS | B | L | LCM | Pos. angle | r | MU | MP |
| 249 | 1522 | 134 | 819 | 9.82 | 311.37 | 19.47 | 301.36 | 0.3798 | 378.2 | 212.9 | |
|
previous
or next observation for the same group /
back to the solar disc SOHO MDI 1999-12-10 11:11:33 UT |
| spot | Proj. U | Proj. WS | Corr. U | Corr. WS | B | L | LCM | Pos. angle | r | MU | MP |
| 0 | 4 | 0 | 2 | 6.21 | 316.81 | 24.90 | 285.16 | 0.4356 | -282.0 | -295.4 | |
| 126 | 820 | 70 | 454 | 9.49 | 316.93 | 25.03 | 292.18 | 0.4526 | 1805.5 | 717.9 | |
| 4 | -2 | 2 | -2 | 9.57 | 315.24 | 23.34 | 293.70 | 0.4284 | 1422.0 | 999999 | |
| 0 | 4 | 0 | 2 | 7.24 | 314.92 | 23.02 | 288.71 | 0.4114 | 464.0 | 304.3 | |
| 0 | 3 | 0 | 2 | 8.94 | 314.65 | 22.74 | 292.83 | 0.4162 | 784.0 | 649.2 | |
| 3 | -2 | 1 | -2 | 9.76 | 314.66 | 22.76 | 294.63 | 0.4212 | 883.2 | 999999 | |
| 0 | 3 | 0 | 2 | 10.73 | 314.69 | 22.79 | 296.71 | 0.4279 | 454.0 | 356.6 | |
| 0 | 6 | 0 | 3 | 10.26 | 314.57 | 22.67 | 295.82 | 0.4231 | 130.0 | 189.8 | |
| 10 | 41 | 6 | 22 | 7.09 | 313.87 | 21.97 | 289.13 | 0.3946 | 672.1 | -175.9 | |
| 4 | 16 | 2 | 8 | 9.52 | 313.97 | 22.07 | 294.74 | 0.4098 | 1237.5 | 1025.6 | |
| 3 | 36 | 2 | 20 | 9.06 | 313.77 | 21.87 | 293.87 | 0.4041 | 1272.7 | 726.1 | |
| 5 | -11 | 3 | -11 | 8.67 | 313.58 | 21.68 | 293.14 | 0.3989 | 1052.2 | 999999 | |
| 0 | 7 | 0 | 4 | 7.78 | 313.49 | 21.59 | 291.11 | 0.3925 | -793.0 | -638.0 | |
| 2 | -9 | 1 | -9 | 7.28 | 313.38 | 21.48 | 289.98 | 0.3882 | -878.7 | 999999 | |
| 0 | 5 | 0 | 3 | 8.32 | 313.11 | 21.20 | 292.75 | 0.3898 | 771.0 | 693.2 | |
| 0 | 10 | 0 | 5 | 9.44 | 312.92 | 21.02 | 295.59 | 0.3941 | 1114.0 | 928.3 | |
| 0 | 9 | 0 | 5 | 9.29 | 312.71 | 20.81 | 295.44 | 0.3899 | 1077.0 | 1040.4 | |
| 0 | 2 | 0 | 1 | 10.88 | 312.65 | 20.75 | 299.16 | 0.4001 | 469.0 | 393.2 | |
| 0 | 6 | 0 | 3 | 9.09 | 311.25 | 19.35 | 296.54 | 0.3673 | 925.0 | 735.0 | |
| 0 | 3 | 0 | 2 | 8.04 | 310.13 | 18.23 | 295.14 | 0.3438 | 669.0 | 699.0 | |
| 0 | 5 | 0 | 3 | 7.73 | 309.27 | 17.37 | 295.34 | 0.3287 | 749.0 | 789.4 | |
| 0 | 5 | 0 | 3 | 8.12 | 307.91 | 16.01 | 298.25 | 0.3114 | 846.0 | 757.8 | |
| 0 | 2 | 0 | 1 | 10.40 | 306.53 | 14.63 | 306.84 | 0.3118 | -743.0 | -711.2 | |
| 0 | 6 | 0 | 3 | 12.31 | 302.86 | 10.95 | 319.68 | 0.2883 | -697.0 | -570.6 | |
| 43 | 514 | 22 | 263 | 10.39 | 302.07 | 10.17 | 316.98 | 0.2557 | -1890.3 | -714.8 | |
| 0 | 5 | 0 | 2 | 9.23 | 301.96 | 10.05 | 313.94 | 0.2404 | -619.0 | -481.0 | |
| 0 | 2 | 0 | 1 | 8.22 | 301.46 | 9.56 | 312.15 | 0.2226 | -830.0 | -756.8 | |
| 26 | -25 | 13 | -25 | 11.56 | 301.40 | 9.50 | 321.90 | 0.2631 | -1682.6 | 999999 | |
| 13 | -25 | 7 | -25 | 10.63 | 301.37 | 9.47 | 319.63 | 0.2507 | -1790.8 | 999999 | |
| 10 | -25 | 5 | -25 | 11.06 | 301.18 | 9.28 | 321.28 | 0.2542 | -1871.3 | 999999 | |
| 0 | 3 | 0 | 2 | 8.57 | 300.84 | 8.94 | 315.20 | 0.2191 | -583.0 | -528.5 | |
| 0 | 3 | 0 | 2 | 11.37 | 300.21 | 8.31 | 325.07 | 0.2485 | -465.0 | -418.6 | |
| 0 | 2 | 0 | 1 | 14.23 | 299.95 | 8.04 | 331.66 | 0.2870 | -902.0 | -873.3 | |
| Proj. U | - Projected umbra area in millionths of solar disc, negative values indicate | |
|
that the umbra consists of fragmented regions which cannot be separated without losing umbral area. In this way several spots (intensity minima in the umbra) have a common umbra, e.g. -2 means that the given spot shares an umbra with spot No.2, and the common U value is indicated at spot No.2. |
||
| Proj. WS | - Projected whole spot area in millionths of solar disc, negative values indicate | |
|
that several umbras have a common penumbra, e.g. -7 means that the given umbra shares a penumbra with umbra No.7, and the WS value is indicated at No.7. |
||
| Corr. U | - Corrected umbra area in millionths of solar hemisphere, for negative values see above | |
| Corr. WS | - Corrected whole spot area in millionths of solar hemisphere, for negative values see above | |
| B | - Heliographic latitude B; positive: North, negative: South | |
| L | - Heliographic longitude L | |
| LCM | - Longitudinal distance from the Sun's central meridian | |
| Pos. angle | - Position angle | |
| r | - Distance from the centre of Sun's disc in terms of Sun's radius | |
| MU | - Mean magnetic field within the umbra contour averaged the pixel values with sign. | |
| MP | - Mean magnetic field within the penumbra contour averaged the pixel values with sign. | |