SOHO MDI 2000-07-05 07:59:31 UT
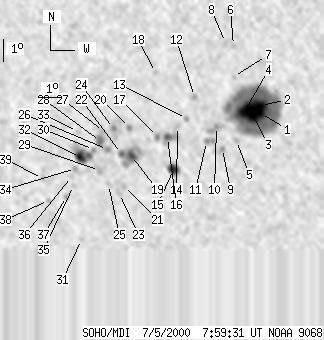
| group | Proj. U | Proj. WS | Corr. U | Corr. WS | B | L | LCM | Pos. angle | r | MU | MP |
| 84 | 638 | 49 | 362 | -18.63 | 49.60 | -19.33 | 140.18 | 0.4887 | -807.6 | -262.6 | |
|
previous
or next observation for the same group /
back to the solar disc SOHO MDI 2000-07-05 07:59:31 UT |
| spot | Proj. U | Proj. WS | Corr. U | Corr. WS | B | L | LCM | Pos. angle | r | MU | MP |
| 7 | 340 | 4 | 189 | -17.92 | 52.52 | -16.41 | 143.38 | 0.4524 | -1793.7 | -726.3 | |
| 10 | -1 | 6 | -1 | -17.58 | 52.55 | -16.38 | 142.95 | 0.4480 | -2362.1 | 999999 | |
| 32 | -1 | 18 | -1 | -17.89 | 52.13 | -16.80 | 142.69 | 0.4556 | -1614.7 | 999999 | |
| -3 | -1 | -3 | -1 | -17.89 | 51.78 | -17.14 | 142.14 | 0.4590 | 999999 | 999999 | |
| 0 | 4 | 0 | 2 | -19.09 | 51.35 | -17.58 | 143.11 | 0.4774 | -756.0 | -590.9 | |
| 0 | 5 | 0 | 3 | -15.07 | 51.61 | -17.32 | 137.58 | 0.4279 | -755.0 | -653.5 | |
| 0 | 3 | 0 | 2 | -16.37 | 51.49 | -17.43 | 139.46 | 0.4440 | -621.0 | -451.1 | |
| 0 | 4 | 0 | 2 | -14.95 | 51.28 | -17.65 | 136.85 | 0.4301 | -755.0 | -598.4 | |
| 0 | 5 | 0 | 3 | -19.45 | 50.69 | -18.24 | 142.59 | 0.4877 | -805.0 | -523.5 | |
| 0 | 21 | 0 | 12 | -18.51 | 50.53 | -18.39 | 141.08 | 0.4782 | -1056.0 | -682.0 | |
| 0 | 10 | 0 | 6 | -19.16 | 50.02 | -18.91 | 141.22 | 0.4907 | -604.0 | -625.7 | |
| 0 | 4 | 0 | 2 | -17.25 | 49.71 | -19.22 | 138.06 | 0.4723 | -783.0 | -738.6 | |
| 0 | 4 | 0 | 2 | -18.20 | 49.25 | -19.68 | 138.77 | 0.4874 | -809.0 | -561.3 | |
| 0 | 7 | 0 | 4 | -18.55 | 48.80 | -20.12 | 138.65 | 0.4957 | -754.0 | -616.5 | |
| 10 | 19 | 6 | 11 | -20.40 | 48.38 | -20.55 | 140.59 | 0.5202 | -919.9 | -597.9 | |
| 4 | 20 | 3 | 11 | -19.03 | 48.30 | -20.63 | 138.63 | 0.5060 | -672.6 | -532.5 | |
| 0 | 6 | 0 | 3 | -19.00 | 47.85 | -21.08 | 137.99 | 0.5101 | -689.0 | -456.4 | |
| 0 | 4 | 0 | 2 | -16.28 | 48.10 | -20.83 | 134.31 | 0.4790 | 584.0 | 621.8 | |
| 7 | 51 | 4 | 30 | -19.84 | 46.56 | -22.37 | 137.50 | 0.5320 | 1159.1 | 663.9 | |
| 0 | 6 | 0 | 4 | -18.64 | 46.64 | -22.29 | 135.94 | 0.5188 | 1157.0 | 828.6 | |
| 0 | 4 | 0 | 2 | -21.20 | 45.98 | -22.95 | 138.58 | 0.5517 | -117.0 | -153.9 | |
| 2 | -19 | 1 | -19 | -19.77 | 46.11 | -22.82 | 136.85 | 0.5357 | 888.0 | 999999 | |
| 0 | 5 | 0 | 3 | -21.51 | 45.74 | -23.19 | 138.70 | 0.5572 | 773.0 | 624.2 | |
| 0 | 13 | 0 | 7 | -18.70 | 45.90 | -23.02 | 135.12 | 0.5271 | 1229.0 | 935.7 | |
| 0 | 6 | 0 | 3 | -21.13 | 45.29 | -23.63 | 137.69 | 0.5576 | 715.0 | 583.6 | |
| 0 | 8 | 0 | 4 | -19.61 | 45.49 | -23.43 | 135.90 | 0.5404 | 1082.0 | 806.3 | |
| 0 | 6 | 0 | 4 | -18.84 | 45.43 | -23.50 | 134.75 | 0.5335 | 843.0 | 820.3 | |
| 4 | 13 | 2 | 7 | -19.27 | 45.22 | -23.70 | 135.12 | 0.5398 | 1101.2 | 959.0 | |
| 0 | 8 | 0 | 5 | -20.53 | 44.98 | -23.95 | 136.54 | 0.5548 | 1004.0 | 735.4 | |
| 0 | 2 | 0 | 1 | -19.63 | 44.85 | -24.08 | 135.17 | 0.5472 | 973.0 | 943.4 | |
| 0 | 3 | 0 | 2 | -23.59 | 43.56 | -25.37 | 138.82 | 0.5986 | 518.0 | 343.0 | |
| 8 | 28 | 5 | 17 | -19.99 | 44.19 | -24.74 | 134.91 | 0.5575 | 980.8 | 980.0 | |
| 0 | 5 | 0 | 3 | -18.87 | 44.23 | -24.70 | 133.42 | 0.5464 | 417.0 | 451.1 | |
| 0 | 5 | 0 | 3 | -20.47 | 43.87 | -25.06 | 135.21 | 0.5654 | 917.0 | 709.1 | |
| 0 | 4 | 0 | 3 | -21.21 | 43.64 | -25.28 | 135.94 | 0.5748 | 610.0 | 409.7 | |
| 0 | 4 | 0 | 2 | -20.82 | 43.62 | -25.31 | 135.41 | 0.5713 | 696.0 | 608.2 | |
| 0 | 4 | 0 | 3 | -21.71 | 43.22 | -25.71 | 136.12 | 0.5836 | 763.0 | 546.2 | |
| 0 | 3 | 0 | 2 | -21.91 | 42.32 | -26.60 | 135.44 | 0.5943 | 766.0 | 500.5 | |
| 0 | 4 | 0 | 3 | -20.95 | 42.23 | -26.70 | 134.10 | 0.5865 | 772.0 | 573.1 | |
| Proj. U | - Projected umbra area in millionths of solar disc, negative values indicate | |
|
that the umbra consists of fragmented regions which cannot be separated without losing umbral area. In this way several spots (intensity minima in the umbra) have a common umbra, e.g. -2 means that the given spot shares an umbra with spot No.2, and the common U value is indicated at spot No.2. |
||
| Proj. WS | - Projected whole spot area in millionths of solar disc, negative values indicate | |
|
that several umbras have a common penumbra, e.g. -7 means that the given umbra shares a penumbra with umbra No.7, and the WS value is indicated at No.7. |
||
| Corr. U | - Corrected umbra area in millionths of solar hemisphere, for negative values see above | |
| Corr. WS | - Corrected whole spot area in millionths of solar hemisphere, for negative values see above | |
| B | - Heliographic latitude B; positive: North, negative: South | |
| L | - Heliographic longitude L | |
| LCM | - Longitudinal distance from the Sun's central meridian | |
| Pos. angle | - Position angle | |
| r | - Distance from the centre of Sun's disc in terms of Sun's radius | |
| MU | - Mean magnetic field within the umbra contour averaged the pixel values with sign. | |
| MP | - Mean magnetic field within the penumbra contour averaged the pixel values with sign. | |