SOHO MDI 2000-07-06 01:35:31 UT
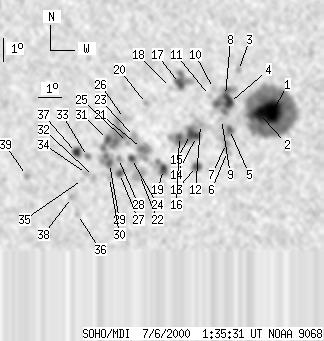
| group | Proj. U | Proj. WS | Corr. U | Corr. WS | B | L | LCM | Pos. angle | r | MU | MP |
| 125 | 839 | 68 | 454 | -18.48 | 49.23 | -9.98 | 156.62 | 0.4110 | -892.6 | -202.9 | |
|
previous
or next observation for the same group /
back to the solar disc SOHO MDI 2000-07-06 01:35:31 UT |
| spot | Proj. U | Proj. WS | Corr. U | Corr. WS | B | L | LCM | Pos. angle | r | MU | MP |
| 36 | 334 | 19 | 179 | -17.76 | 52.21 | -7.00 | 162.22 | 0.3820 | -2160.8 | -723.5 | |
| 19 | -1 | 10 | -1 | -17.85 | 51.66 | -7.55 | 161.01 | 0.3862 | -1664.9 | 999999 | |
| 0 | 4 | 0 | 2 | -16.04 | 50.86 | -8.35 | 157.31 | 0.3634 | -1108.0 | -870.0 | |
| 7 | 66 | 4 | 36 | -17.40 | 50.43 | -8.79 | 157.72 | 0.3864 | -1560.9 | -958.2 | |
| 4 | 16 | 2 | 9 | -18.55 | 50.37 | -8.85 | 158.73 | 0.4038 | -1096.7 | -868.0 | |
| 0 | 8 | 0 | 4 | -19.49 | 50.23 | -8.99 | 159.31 | 0.4185 | -688.0 | -664.1 | |
| 0 | 12 | 0 | 6 | -19.15 | 50.21 | -9.01 | 158.95 | 0.4136 | -1001.0 | -772.6 | |
| 2 | -4 | 1 | -4 | -17.10 | 50.27 | -8.94 | 157.06 | 0.3829 | -1263.8 | 999999 | |
| 0 | 2 | 0 | 1 | -18.12 | 50.05 | -9.16 | 157.63 | 0.3994 | -952.0 | -940.5 | |
| 0 | 4 | 0 | 2 | -16.81 | 49.78 | -9.43 | 155.63 | 0.3818 | 361.0 | 211.3 | |
| 0 | 1 | 0 | 1 | -17.11 | 49.60 | -9.62 | 155.55 | 0.3874 | -133.0 | -178.8 | |
| 0 | 19 | 0 | 10 | -18.35 | 49.15 | -10.07 | 155.92 | 0.4083 | -1172.0 | -900.1 | |
| 6 | 12 | 4 | 7 | -20.15 | 48.87 | -10.35 | 157.15 | 0.4362 | -1097.1 | -767.1 | |
| 11 | 68 | 6 | 37 | -18.86 | 48.95 | -10.27 | 156.04 | 0.4171 | -1202.3 | -614.8 | |
| -14 | -14 | -14 | -14 | -18.78 | 48.70 | -10.52 | 155.44 | 0.4175 | 999999 | 999999 | |
| 4 | -14 | 2 | -14 | -18.87 | 48.23 | -10.99 | 154.58 | 0.4220 | -1022.1 | 999999 | |
| 8 | 32 | 4 | 17 | -16.62 | 48.37 | -10.85 | 152.25 | 0.3891 | 1057.3 | 885.5 | |
| 0 | 3 | 0 | 1 | -16.79 | 47.98 | -11.24 | 151.63 | 0.3945 | 706.0 | 666.8 | |
| 7 | 23 | 4 | 13 | -20.30 | 47.44 | -11.78 | 154.55 | 0.4474 | -879.7 | -258.5 | |
| 0 | 4 | 0 | 2 | -17.48 | 46.92 | -12.30 | 150.33 | 0.4123 | 1040.0 | 859.3 | |
| 0 | 28 | 0 | 16 | -19.41 | 46.56 | -12.66 | 151.95 | 0.4413 | 1394.0 | 967.9 | |
| 0 | 20 | 0 | 11 | -20.53 | 46.38 | -12.84 | 152.85 | 0.4579 | -328.0 | 13.5 | |
| 0 | 14 | 0 | 8 | -18.90 | 46.30 | -12.92 | 150.87 | 0.4363 | 1133.0 | 926.7 | |
| 3 | 12 | 2 | 6 | -19.85 | 46.09 | -13.13 | 151.58 | 0.4507 | 1234.5 | 955.9 | |
| 0 | 4 | 0 | 2 | -19.16 | 45.98 | -13.24 | 150.58 | 0.4423 | 1165.0 | 932.0 | |
| 0 | 6 | 0 | 3 | -18.13 | 45.93 | -13.29 | 149.25 | 0.4289 | 1015.0 | 819.0 | |
| 4 | 11 | 2 | 6 | -20.50 | 45.51 | -13.70 | 151.29 | 0.4638 | 976.5 | 674.5 | |
| 0 | 4 | 0 | 2 | -19.85 | 45.53 | -13.69 | 150.58 | 0.4551 | 1305.0 | 1002.9 | |
| 4 | 20 | 2 | 11 | -20.08 | 45.12 | -14.10 | 150.12 | 0.4612 | 1053.1 | 1013.6 | |
| 0 | 4 | 0 | 2 | -20.68 | 45.06 | -14.16 | 150.71 | 0.4696 | 745.0 | 602.4 | |
| 5 | 63 | 3 | 35 | -19.04 | 45.12 | -14.09 | 148.90 | 0.4475 | 1340.6 | 1206.1 | |
| 0 | 6 | 0 | 3 | -20.65 | 44.36 | -14.85 | 149.50 | 0.4745 | 877.0 | 658.3 | |
| 0 | 7 | 0 | 4 | -19.79 | 44.19 | -15.03 | 148.19 | 0.4648 | 718.0 | 782.8 | |
| 0 | 5 | 0 | 3 | -20.53 | 44.07 | -15.15 | 148.87 | 0.4752 | 932.0 | 819.1 | |
| 0 | 2 | 0 | 1 | -20.79 | 43.87 | -15.35 | 148.84 | 0.4802 | 744.0 | 547.1 | |
| 0 | 3 | 0 | 2 | -22.33 | 43.48 | -15.74 | 149.93 | 0.5029 | 460.0 | 509.3 | |
| 5 | 14 | 3 | 8 | -19.62 | 43.72 | -15.49 | 147.21 | 0.4665 | 1077.7 | 860.3 | |
| 0 | 4 | 0 | 2 | -21.58 | 43.30 | -15.92 | 148.83 | 0.4949 | 834.0 | 749.3 | |
| 0 | 4 | 0 | 2 | -20.66 | 41.41 | -17.81 | 144.86 | 0.4992 | 729.0 | 607.6 | |
| Proj. U | - Projected umbra area in millionths of solar disc, negative values indicate | |
|
that the umbra consists of fragmented regions which cannot be separated without losing umbral area. In this way several spots (intensity minima in the umbra) have a common umbra, e.g. -2 means that the given spot shares an umbra with spot No.2, and the common U value is indicated at spot No.2. |
||
| Proj. WS | - Projected whole spot area in millionths of solar disc, negative values indicate | |
|
that several umbras have a common penumbra, e.g. -7 means that the given umbra shares a penumbra with umbra No.7, and the WS value is indicated at No.7. |
||
| Corr. U | - Corrected umbra area in millionths of solar hemisphere, for negative values see above | |
| Corr. WS | - Corrected whole spot area in millionths of solar hemisphere, for negative values see above | |
| B | - Heliographic latitude B; positive: North, negative: South | |
| L | - Heliographic longitude L | |
| LCM | - Longitudinal distance from the Sun's central meridian | |
| Pos. angle | - Position angle | |
| r | - Distance from the centre of Sun's disc in terms of Sun's radius | |
| MU | - Mean magnetic field within the umbra contour averaged the pixel values with sign. | |
| MP | - Mean magnetic field within the penumbra contour averaged the pixel values with sign. | |