SOHO MDI 2000-07-10 22:23:31 UT
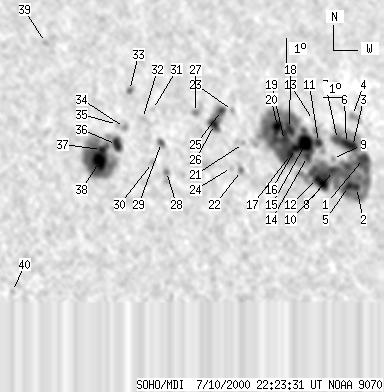
| group | Proj. U | Proj. WS | Corr. U | Corr. WS | B | L | LCM | Pos. angle | r | MU | MP |
| 177 | 1236 | 116 | 822 | 17.56 | 34.78 | 40.00 | 292.44 | 0.6632 | 226.2 | 264.7 | |
|
previous
or next observation for the same group /
back to the solar disc SOHO MDI 2000-07-10 22:23:31 UT |
| spot | Proj. U | Proj. WS | Corr. U | Corr. WS | B | L | LCM | Pos. angle | r | MU | MP |
| 9 | 877 | 6 | 600 | 17.03 | 39.59 | 44.81 | 289.96 | 0.7192 | 999.8 | 518.3 | |
| 5 | -1 | 3 | -1 | 15.88 | 38.85 | 44.07 | 288.57 | 0.7080 | -690.9 | 999999 | |
| 5 | -1 | 3 | -1 | 17.55 | 39.11 | 44.33 | 290.80 | 0.7150 | 857.2 | 999999 | |
| 0 | 14 | 0 | 10 | 18.80 | 39.52 | 44.73 | 292.40 | 0.7229 | 370.0 | 365.2 | |
| 6 | -1 | 4 | -1 | 15.94 | 38.41 | 43.63 | 288.77 | 0.7030 | -849.2 | 999999 | |
| 7 | -1 | 5 | -1 | 17.68 | 38.80 | 44.02 | 291.08 | 0.7118 | 1075.9 | 999999 | |
| 3 | -1 | 2 | -1 | 17.87 | 38.34 | 43.56 | 291.47 | 0.7070 | 1045.6 | 999999 | |
| 5 | -1 | 3 | -1 | 16.63 | 37.75 | 42.96 | 289.91 | 0.6968 | 1227.6 | 999999 | |
| 0 | 4 | 0 | 3 | 17.11 | 37.83 | 43.04 | 290.57 | 0.6991 | 733.0 | 672.8 | |
| 11 | -1 | 8 | -1 | 16.09 | 37.04 | 42.25 | 289.34 | 0.6870 | -646.9 | 999999 | |
| 6 | -1 | 4 | -1 | 17.80 | 37.23 | 42.45 | 291.71 | 0.6940 | 797.3 | 999999 | |
| 6 | -1 | 4 | -1 | 16.35 | 36.77 | 41.99 | 289.79 | 0.6845 | -433.2 | 999999 | |
| 0 | 4 | 0 | 3 | 18.70 | 37.22 | 42.44 | 292.98 | 0.6966 | 307.0 | 364.4 | |
| 5 | -1 | 4 | -1 | 17.26 | 36.46 | 41.68 | 291.19 | 0.6833 | 961.6 | 999999 | |
| 24 | -1 | 16 | -1 | 17.79 | 36.50 | 41.72 | 291.93 | 0.6854 | 1191.2 | 999999 | |
| 5 | -1 | 4 | -1 | 17.61 | 35.89 | 41.11 | 291.88 | 0.6776 | 1468.7 | 999999 | |
| 4 | -1 | 3 | -1 | 17.38 | 35.55 | 40.77 | 291.66 | 0.6729 | 1546.9 | 999999 | |
| 9 | -1 | 6 | -1 | 18.44 | 35.80 | 41.01 | 293.10 | 0.6791 | 848.9 | 999999 | |
| 6 | -1 | 4 | -1 | 17.96 | 35.38 | 40.60 | 292.56 | 0.6727 | 1424.7 | 999999 | |
| 9 | -1 | 6 | -1 | 18.55 | 35.16 | 40.38 | 293.48 | 0.6720 | 1266.7 | 999999 | |
| 0 | 9 | 0 | 6 | 17.93 | 33.16 | 38.38 | 293.36 | 0.6457 | -682.0 | -454.7 | |
| 0 | 7 | 0 | 4 | 16.85 | 32.78 | 38.00 | 291.86 | 0.6372 | 799.0 | 556.7 | |
| 0 | 4 | 0 | 2 | 19.30 | 32.94 | 38.15 | 295.49 | 0.6482 | 572.0 | 486.9 | |
| 0 | 3 | 0 | 2 | 16.99 | 32.29 | 37.51 | 292.27 | 0.6315 | 664.0 | 532.2 | |
| 5 | 45 | 3 | 29 | 19.33 | 32.36 | 37.57 | 295.78 | 0.6413 | 874.7 | 210.6 | |
| 8 | -25 | 5 | -25 | 18.77 | 31.84 | 37.06 | 295.18 | 0.6327 | -730.6 | 999999 | |
| 0 | 14 | 0 | 9 | 19.30 | 30.98 | 36.20 | 296.38 | 0.6245 | -754.0 | -108.7 | |
| 0 | 15 | 0 | 9 | 16.96 | 28.96 | 34.17 | 293.68 | 0.5889 | -550.0 | -515.3 | |
| 3 | 9 | 2 | 5 | 18.14 | 28.96 | 34.18 | 295.60 | 0.5941 | -877.7 | -643.8 | |
| 0 | 4 | 0 | 3 | 17.35 | 28.34 | 33.55 | 294.63 | 0.5826 | -703.0 | -707.6 | |
| 0 | 3 | 0 | 2 | 19.51 | 28.82 | 34.04 | 297.83 | 0.5988 | -583.0 | -443.5 | |
| 0 | 7 | 0 | 5 | 19.16 | 28.23 | 33.45 | 297.61 | 0.5898 | -782.0 | -608.4 | |
| 0 | 8 | 0 | 5 | 20.33 | 27.86 | 33.07 | 299.68 | 0.5912 | -897.0 | -726.8 | |
| 0 | 5 | 0 | 3 | 18.82 | 27.26 | 32.47 | 297.64 | 0.5758 | -916.0 | -823.2 | |
| 0 | 2 | 0 | 1 | 18.96 | 26.94 | 32.16 | 298.05 | 0.5725 | -706.0 | -718.2 | |
| 10 | 195 | 6 | 116 | 18.14 | 26.72 | 31.94 | 296.84 | 0.5655 | -1113.7 | -770.7 | |
| 4 | -36 | 2 | -36 | 17.97 | 25.95 | 31.17 | 297.00 | 0.5546 | -1205.6 | 999999 | |
| 22 | -36 | 13 | -36 | 17.48 | 25.76 | 30.97 | 296.30 | 0.5497 | -1777.7 | 999999 | |
| 0 | 4 | 0 | 3 | 22.46 | 24.18 | 29.39 | 305.61 | 0.5600 | 804.0 | 798.9 | |
| 0 | 3 | 0 | 2 | 12.38 | 20.94 | 26.16 | 289.52 | 0.4588 | 587.0 | 440.3 | |
| Proj. U | - Projected umbra area in millionths of solar disc, negative values indicate | |
|
that the umbra consists of fragmented regions which cannot be separated without losing umbral area. In this way several spots (intensity minima in the umbra) have a common umbra, e.g. -2 means that the given spot shares an umbra with spot No.2, and the common U value is indicated at spot No.2. |
||
| Proj. WS | - Projected whole spot area in millionths of solar disc, negative values indicate | |
|
that several umbras have a common penumbra, e.g. -7 means that the given umbra shares a penumbra with umbra No.7, and the WS value is indicated at No.7. |
||
| Corr. U | - Corrected umbra area in millionths of solar hemisphere, for negative values see above | |
| Corr. WS | - Corrected whole spot area in millionths of solar hemisphere, for negative values see above | |
| B | - Heliographic latitude B; positive: North, negative: South | |
| L | - Heliographic longitude L | |
| LCM | - Longitudinal distance from the Sun's central meridian | |
| Pos. angle | - Position angle | |
| r | - Distance from the centre of Sun's disc in terms of Sun's radius | |
| MU | - Mean magnetic field within the umbra contour averaged the pixel values with sign. | |
| MP | - Mean magnetic field within the penumbra contour averaged the pixel values with sign. | |