SOHO MDI 2000-09-28 22:23:32 UT
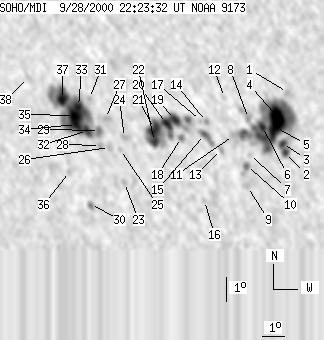
| group | Proj. U | Proj. WS | Corr. U | Corr. WS | B | L | LCM | Pos. angle | r | MU | MP |
| 134 | 759 | 79 | 444 | -11.38 | 351.69 | -25.42 | 125.92 | 0.5196 | -72.1 | 18.4 | |
|
previous
or next observation for the same group /
back to the solar disc SOHO MDI 2000-09-28 22:23:32 UT |
| spot | Proj. U | Proj. WS | Corr. U | Corr. WS | B | L | LCM | Pos. angle | r | MU | MP |
| 0 | 4 | 0 | 2 | -9.77 | 356.54 | -20.57 | 128.71 | 0.4455 | -837.0 | -729.8 | |
| 4 | 274 | 2 | 153 | -12.23 | 356.28 | -20.83 | 132.48 | 0.4732 | -859.3 | -621.0 | |
| 4 | -2 | 2 | -2 | -11.87 | 356.18 | -20.93 | 131.76 | 0.4706 | -961.8 | 999999 | |
| 38 | -2 | 21 | -2 | -10.77 | 356.05 | -21.06 | 129.77 | 0.4612 | -1751.0 | 999999 | |
| -4 | -2 | -4 | -2 | -11.22 | 355.93 | -21.18 | 130.37 | 0.4670 | 999999 | 999999 | |
| 5 | -2 | 3 | -2 | -11.21 | 355.38 | -21.73 | 129.61 | 0.4734 | -1009.7 | 999999 | |
| 0 | 2 | 0 | 1 | -12.38 | 354.72 | -22.39 | 130.67 | 0.4925 | -228.0 | -122.7 | |
| 0 | 19 | 0 | 11 | -10.91 | 354.80 | -22.31 | 128.38 | 0.4774 | -169.0 | -380.4 | |
| 0 | 6 | 0 | 4 | -13.72 | 354.50 | -22.60 | 132.43 | 0.5080 | -468.0 | -473.8 | |
| 0 | 13 | 0 | 7 | -12.85 | 354.55 | -22.56 | 131.17 | 0.4989 | -813.0 | -643.0 | |
| 0 | 3 | 0 | 2 | -11.63 | 354.10 | -23.01 | 128.70 | 0.4926 | 258.0 | 202.4 | |
| 0 | 3 | 0 | 2 | -10.10 | 353.83 | -23.27 | 125.83 | 0.4818 | -615.0 | -581.4 | |
| 0 | 7 | 0 | 4 | -12.24 | 353.52 | -23.59 | 128.96 | 0.5050 | 671.0 | 503.7 | |
| 0 | 5 | 0 | 3 | -11.12 | 352.97 | -24.14 | 126.53 | 0.5014 | 794.0 | 564.5 | |
| 3 | 17 | 2 | 10 | -11.66 | 352.83 | -24.27 | 127.24 | 0.5078 | -476.4 | -396.9 | |
| 0 | 3 | 0 | 2 | -14.40 | 352.54 | -24.56 | 131.07 | 0.5362 | -525.0 | -520.1 | |
| 0 | 2 | 0 | 1 | -11.09 | 352.71 | -24.40 | 126.19 | 0.5043 | 517.0 | 487.8 | |
| 0 | 6 | 0 | 4 | -11.83 | 351.81 | -25.30 | 126.38 | 0.5216 | 824.0 | 656.5 | |
| 8 | 133 | 5 | 78 | -11.11 | 351.62 | -25.49 | 125.01 | 0.5177 | 1206.9 | 248.0 | |
| 6 | -19 | 4 | -19 | -11.29 | 351.20 | -25.91 | 124.87 | 0.5243 | 777.2 | 999999 | |
| 15 | -19 | 9 | -19 | -11.53 | 350.65 | -26.46 | 124.67 | 0.5330 | -1051.0 | 999999 | |
| 9 | -19 | 5 | -19 | -12.06 | 350.59 | -26.52 | 125.45 | 0.5381 | 842.2 | 999999 | |
| 0 | 5 | 0 | 3 | -13.84 | 349.03 | -28.08 | 126.54 | 0.5711 | -262.0 | -320.1 | |
| 0 | 9 | 0 | 5 | -11.97 | 349.26 | -27.85 | 123.99 | 0.5534 | -240.0 | -166.8 | |
| 0 | 3 | 0 | 2 | -12.48 | 349.02 | -28.09 | 124.53 | 0.5602 | 568.0 | 465.0 | |
| 0 | 8 | 0 | 5 | -12.43 | 348.52 | -28.58 | 123.98 | 0.5657 | 690.0 | 522.5 | |
| 0 | 8 | 0 | 5 | -11.24 | 348.48 | -28.63 | 122.14 | 0.5571 | 672.0 | 612.7 | |
| 0 | 4 | 0 | 3 | -12.37 | 348.12 | -28.99 | 123.52 | 0.5700 | 884.0 | 822.6 | |
| 0 | 8 | 0 | 5 | -11.75 | 348.15 | -28.96 | 122.62 | 0.5650 | 984.0 | 863.6 | |
| 0 | 8 | 0 | 5 | -14.86 | 347.32 | -29.79 | 126.37 | 0.5987 | 481.0 | 463.6 | |
| 0 | 3 | 0 | 2 | -10.46 | 347.84 | -29.27 | 120.36 | 0.5594 | 853.0 | 740.5 | |
| 5 | 195 | 3 | 118 | -11.78 | 347.60 | -29.51 | 122.18 | 0.5719 | 1182.5 | 651.2 | |
| 7 | -32 | 4 | -32 | -10.82 | 347.30 | -29.81 | 120.45 | 0.5686 | 1659.5 | 999999 | |
| 6 | -32 | 4 | -32 | -11.57 | 347.12 | -29.99 | 121.44 | 0.5761 | 1081.1 | 999999 | |
| 13 | -32 | 8 | -32 | -11.20 | 347.07 | -30.04 | 120.84 | 0.5741 | 1458.1 | 999999 | |
| 0 | 3 | 0 | 2 | -13.54 | 346.54 | -30.57 | 123.82 | 0.5974 | 369.0 | 395.2 | |
| 11 | -32 | 7 | -32 | -10.58 | 346.59 | -30.52 | 119.49 | 0.5757 | 1044.8 | 999999 | |
| 0 | 8 | 0 | 5 | -9.78 | 345.10 | -32.01 | 117.11 | 0.5890 | 509.0 | 384.9 | |
| Proj. U | - Projected umbra area in millionths of solar disc, negative values indicate | |
|
that the umbra consists of fragmented regions which cannot be separated without losing umbral area. In this way several spots (intensity minima in the umbra) have a common umbra, e.g. -2 means that the given spot shares an umbra with spot No.2, and the common U value is indicated at spot No.2. |
||
| Proj. WS | - Projected whole spot area in millionths of solar disc, negative values indicate | |
|
that several umbras have a common penumbra, e.g. -7 means that the given umbra shares a penumbra with umbra No.7, and the WS value is indicated at No.7. |
||
| Corr. U | - Corrected umbra area in millionths of solar hemisphere, for negative values see above | |
| Corr. WS | - Corrected whole spot area in millionths of solar hemisphere, for negative values see above | |
| B | - Heliographic latitude B; positive: North, negative: South | |
| L | - Heliographic longitude L | |
| LCM | - Longitudinal distance from the Sun's central meridian | |
| Pos. angle | - Position angle | |
| r | - Distance from the centre of Sun's disc in terms of Sun's radius | |
| MU | - Mean magnetic field within the umbra contour averaged the pixel values with sign. | |
| MP | - Mean magnetic field within the penumbra contour averaged the pixel values with sign. | |