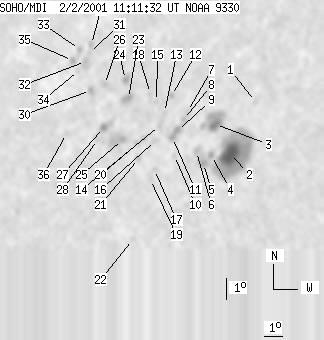
SOHO MDI 2001-02-02 11:11:32 UT
| group | Proj. U | Proj. WS | Corr. U | Corr. WS | B | L | LCM | Pos. angle | r | MU | MP |
| 60 | 489 | 40 | 351 | 24.88 | 114.55 | -35.17 | 46.31 | 0.7224 | 782.6 | 222.1 | |
|
previous
or next observation for the same group /
back to the solar disc SOHO MDI 2001-02-02 11:11:32 UT |
| spot | Proj. U | Proj. WS | Corr. U | Corr. WS | B | L | LCM | Pos. angle | r | MU | MP |
| 0 | 3 | 0 | 2 | 26.02 | 118.07 | -31.65 | 42.34 | 0.7025 | -480.0 | -368.5 | |
| 31 | 201 | 21 | 137 | 23.75 | 117.48 | -32.24 | 45.33 | 0.6889 | 1436.6 | 657.1 | |
| 12 | 55 | 8 | 39 | 25.10 | 116.33 | -33.39 | 44.79 | 0.7098 | 824.2 | 139.9 | |
| 0 | 7 | 0 | 5 | 23.72 | 116.54 | -33.18 | 46.15 | 0.6971 | 800.0 | 719.5 | |
| 3 | 12 | 2 | 9 | 23.38 | 116.24 | -33.48 | 46.77 | 0.6973 | 810.4 | 700.3 | |
| 0 | 9 | 0 | 6 | 23.94 | 115.72 | -34.00 | 46.56 | 0.7063 | 697.0 | 594.9 | |
| 0 | 3 | 0 | 2 | 25.79 | 114.66 | -35.05 | 45.35 | 0.7293 | 315.0 | 275.4 | |
| 0 | 5 | 0 | 4 | 25.44 | 114.57 | -35.14 | 45.80 | 0.7275 | 390.0 | 248.8 | |
| 3 | 17 | 2 | 12 | 24.96 | 114.42 | -35.30 | 46.44 | 0.7252 | 599.2 | 478.9 | |
| 0 | 4 | 0 | 3 | 23.84 | 114.63 | -35.09 | 47.53 | 0.7153 | 533.0 | 508.9 | |
| 2 | -9 | 1 | -9 | 24.66 | 114.26 | -35.46 | 46.90 | 0.7245 | 592.0 | 999999 | |
| 0 | 4 | 0 | 3 | 26.58 | 113.54 | -36.18 | 45.34 | 0.7445 | -587.0 | -588.2 | |
| 0 | 2 | 0 | 2 | 25.83 | 113.44 | -36.28 | 46.23 | 0.7399 | -624.0 | -546.4 | |
| 0 | 3 | 0 | 2 | 25.25 | 113.38 | -36.34 | 46.90 | 0.7363 | -201.0 | -119.6 | |
| 0 | 3 | 0 | 2 | 26.36 | 112.82 | -36.90 | 46.11 | 0.7489 | 231.0 | 142.9 | |
| 0 | 7 | 0 | 5 | 24.58 | 113.40 | -36.32 | 47.62 | 0.7315 | 154.0 | 236.6 | |
| 0 | 4 | 0 | 3 | 23.28 | 113.77 | -35.95 | 48.81 | 0.7190 | 467.0 | 443.7 | |
| 0 | 4 | 0 | 3 | 26.76 | 112.34 | -37.37 | 46.02 | 0.7555 | -355.0 | -316.3 | |
| 0 | 5 | 0 | 3 | 22.85 | 113.70 | -36.02 | 49.35 | 0.7166 | 599.0 | 486.0 | |
| 0 | 12 | 0 | 9 | 24.72 | 112.72 | -37.00 | 47.97 | 0.7384 | 368.0 | 294.6 | |
| 0 | 5 | 0 | 4 | 23.83 | 112.76 | -36.96 | 48.93 | 0.7320 | 513.0 | 408.6 | |
| 0 | 3 | 0 | 2 | 20.28 | 113.52 | -36.20 | 52.50 | 0.7006 | 541.0 | 502.9 | |
| 3 | 12 | 2 | 9 | 26.61 | 111.20 | -38.52 | 46.98 | 0.7640 | -944.0 | -755.0 | |
| 2 | 11 | 1 | 9 | 27.51 | 110.66 | -39.06 | 46.39 | 0.7742 | 399.8 | 238.6 | |
| 0 | 29 | 0 | 22 | 24.75 | 111.58 | -38.13 | 48.73 | 0.7485 | 314.0 | -420.9 | |
| 0 | 6 | 0 | 5 | 27.36 | 109.54 | -40.17 | 47.28 | 0.7822 | -728.0 | -595.8 | |
| 4 | 14 | 3 | 10 | 25.37 | 110.31 | -39.40 | 48.91 | 0.7634 | -877.5 | -825.8 | |
| 0 | 3 | 0 | 2 | 24.85 | 110.19 | -39.53 | 49.56 | 0.7612 | -785.0 | -786.9 | |
| 0 | 7 | 0 | 6 | 29.33 | 107.86 | -41.86 | 46.30 | 0.8070 | -354.0 | -369.4 | |
| 0 | 6 | 0 | 5 | 27.14 | 108.84 | -40.87 | 47.96 | 0.7864 | -706.0 | -677.3 | |
| 0 | 3 | 0 | 2 | 28.95 | 107.93 | -41.78 | 46.64 | 0.8042 | -532.0 | -472.9 | |
| 0 | 13 | 0 | 10 | 28.54 | 107.90 | -41.82 | 47.09 | 0.8021 | -724.0 | -660.5 | |
| 0 | 5 | 0 | 4 | 29.14 | 107.24 | -42.48 | 46.86 | 0.8105 | -214.0 | -192.3 | |
| 0 | 3 | 0 | 2 | 28.14 | 107.68 | -42.03 | 47.63 | 0.8014 | -479.0 | -519.3 | |
| 0 | 5 | 0 | 5 | 28.65 | 107.08 | -42.64 | 47.47 | 0.8089 | -489.0 | -373.2 | |
| 0 | 4 | 0 | 3 | 25.26 | 108.29 | -41.42 | 50.33 | 0.7797 | -486.0 | -346.8 | |
| Proj. U | - Projected umbra area in millionths of solar disc, negative values indicate | |
|
that the umbra consists of fragmented regions which cannot be separated without losing umbral area. In this way several spots (intensity minima in the umbra) have a common umbra, e.g. -2 means that the given spot shares an umbra with spot No.2, and the common U value is indicated at spot No.2. |
||
| Proj. WS | - Projected whole spot area in millionths of solar disc, negative values indicate | |
|
that several umbras have a common penumbra, e.g. -7 means that the given umbra shares a penumbra with umbra No.7, and the WS value is indicated at No.7. |
||
| Corr. U | - Corrected umbra area in millionths of solar hemisphere, for negative values see above | |
| Corr. WS | - Corrected whole spot area in millionths of solar hemisphere, for negative values see above | |
| B | - Heliographic latitude B; positive: North, negative: South | |
| L | - Heliographic longitude L | |
| LCM | - Longitudinal distance from the Sun's central meridian | |
| Pos. angle | - Position angle | |
| r | - Distance from the centre of Sun's disc in terms of Sun's radius | |
| MU | - Mean magnetic field within the umbra contour averaged the pixel values with sign. | |
| MP | - Mean magnetic field within the penumbra contour averaged the pixel values with sign. | |