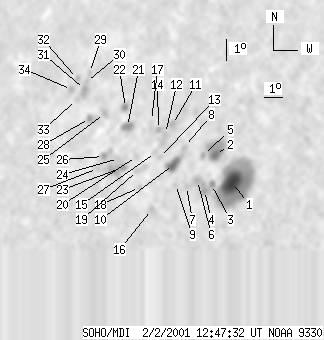
SOHO MDI 2001-02-02 12:47:32 UT
| group | Proj. U | Proj. WS | Corr. U | Corr. WS | B | L | LCM | Pos. angle | r | MU | MP |
| 61 | 475 | 43 | 339 | 24.94 | 114.49 | -34.35 | 45.61 | 0.7158 | 760.6 | 201.4 | |
|
previous
or next observation for the same group /
back to the solar disc SOHO MDI 2001-02-02 12:47:32 UT |
| spot | Proj. U | Proj. WS | Corr. U | Corr. WS | B | L | LCM | Pos. angle | r | MU | MP |
| 31 | 199 | 21 | 134 | 23.73 | 117.49 | -31.35 | 44.58 | 0.6808 | 1393.9 | 669.1 | |
| 9 | 47 | 6 | 32 | 25.04 | 116.27 | -32.57 | 44.17 | 0.7023 | 871.2 | 181.3 | |
| 2 | 5 | 2 | 4 | 23.70 | 116.46 | -32.38 | 45.50 | 0.6899 | 786.5 | 661.5 | |
| 0 | 11 | 0 | 7 | 23.46 | 116.18 | -32.66 | 46.01 | 0.6904 | 834.0 | 732.6 | |
| 0 | 5 | 0 | 4 | 25.08 | 115.66 | -33.18 | 44.64 | 0.7079 | 253.0 | 200.8 | |
| 0 | 3 | 0 | 2 | 23.93 | 115.70 | -33.14 | 45.88 | 0.6985 | 819.0 | 729.8 | |
| 0 | 5 | 0 | 3 | 23.69 | 115.21 | -33.63 | 46.54 | 0.7010 | 417.0 | 447.6 | |
| 0 | 8 | 0 | 6 | 25.51 | 114.55 | -34.29 | 45.06 | 0.7207 | 282.0 | 237.4 | |
| 0 | 3 | 0 | 2 | 23.82 | 114.62 | -34.22 | 46.87 | 0.7073 | 500.0 | 476.6 | |
| 11 | 21 | 8 | 15 | 24.73 | 114.23 | -34.60 | 46.16 | 0.7175 | 586.5 | 372.2 | |
| 0 | 5 | 0 | 4 | 26.56 | 113.56 | -35.28 | 44.69 | 0.7369 | -723.0 | -646.4 | |
| 0 | 14 | 0 | 10 | 26.17 | 113.33 | -35.51 | 45.28 | 0.7359 | -658.0 | -546.7 | |
| 0 | 3 | 0 | 2 | 25.09 | 113.39 | -35.45 | 46.41 | 0.7276 | -204.0 | -83.2 | |
| 0 | 4 | 0 | 3 | 26.38 | 112.89 | -35.95 | 45.39 | 0.7412 | 128.0 | -37.1 | |
| 0 | 4 | 0 | 3 | 25.33 | 113.10 | -35.74 | 46.36 | 0.7319 | 23.0 | -35.2 | |
| 0 | 4 | 0 | 3 | 22.78 | 113.71 | -35.13 | 48.76 | 0.7080 | 694.0 | 492.1 | |
| 0 | 1 | 0 | 0 | 26.82 | 112.35 | -36.49 | 45.31 | 0.7488 | -355.0 | -355.0 | |
| 0 | 4 | 0 | 3 | 23.81 | 112.77 | -36.07 | 48.30 | 0.7238 | 423.0 | 380.1 | |
| 0 | 12 | 0 | 9 | 24.58 | 112.41 | -36.43 | 47.70 | 0.7325 | 347.0 | 317.4 | |
| 0 | 4 | 0 | 3 | 25.22 | 112.14 | -36.70 | 47.20 | 0.7393 | 36.0 | 62.0 | |
| 6 | 14 | 4 | 10 | 26.64 | 111.13 | -37.71 | 46.39 | 0.7575 | -916.6 | -709.9 | |
| 2 | 8 | 2 | 7 | 27.53 | 110.66 | -38.18 | 45.77 | 0.7674 | 308.1 | 164.1 | |
| 0 | 27 | 0 | 20 | 24.77 | 111.55 | -37.29 | 48.11 | 0.7413 | 224.0 | -364.3 | |
| 0 | 5 | 0 | 4 | 25.20 | 111.18 | -37.65 | 47.90 | 0.7473 | -386.0 | -350.1 | |
| 0 | 5 | 0 | 4 | 27.34 | 109.57 | -39.26 | 46.71 | 0.7748 | -776.0 | -581.1 | |
| 0 | 11 | 0 | 9 | 25.35 | 110.32 | -38.52 | 48.34 | 0.7557 | -1041.0 | -840.1 | |
| 0 | 2 | 0 | 2 | 24.82 | 110.19 | -38.65 | 49.00 | 0.7534 | -790.0 | -747.4 | |
| 0 | 7 | 0 | 6 | 27.16 | 108.80 | -40.03 | 47.40 | 0.7799 | -706.0 | -601.7 | |
| 0 | 4 | 0 | 4 | 29.35 | 107.79 | -41.05 | 45.77 | 0.8011 | -536.0 | -408.6 | |
| 0 | 5 | 0 | 4 | 28.93 | 107.82 | -41.02 | 46.18 | 0.7984 | -516.0 | -513.9 | |
| 0 | 12 | 0 | 9 | 28.56 | 107.88 | -40.95 | 46.53 | 0.7956 | -704.0 | -701.3 | |
| 0 | 5 | 0 | 4 | 29.12 | 107.20 | -41.64 | 46.37 | 0.8041 | -239.0 | -177.5 | |
| 0 | 3 | 0 | 2 | 28.12 | 107.63 | -41.21 | 47.14 | 0.7949 | -569.0 | -581.1 | |
| 0 | 5 | 0 | 5 | 28.62 | 107.10 | -41.74 | 46.96 | 0.8020 | -519.0 | -403.2 | |
| Proj. U | - Projected umbra area in millionths of solar disc, negative values indicate | |
|
that the umbra consists of fragmented regions which cannot be separated without losing umbral area. In this way several spots (intensity minima in the umbra) have a common umbra, e.g. -2 means that the given spot shares an umbra with spot No.2, and the common U value is indicated at spot No.2. |
||
| Proj. WS | - Projected whole spot area in millionths of solar disc, negative values indicate | |
|
that several umbras have a common penumbra, e.g. -7 means that the given umbra shares a penumbra with umbra No.7, and the WS value is indicated at No.7. |
||
| Corr. U | - Corrected umbra area in millionths of solar hemisphere, for negative values see above | |
| Corr. WS | - Corrected whole spot area in millionths of solar hemisphere, for negative values see above | |
| B | - Heliographic latitude B; positive: North, negative: South | |
| L | - Heliographic longitude L | |
| LCM | - Longitudinal distance from the Sun's central meridian | |
| Pos. angle | - Position angle | |
| r | - Distance from the centre of Sun's disc in terms of Sun's radius | |
| MU | - Mean magnetic field within the umbra contour averaged the pixel values with sign. | |
| MP | - Mean magnetic field within the penumbra contour averaged the pixel values with sign. | |