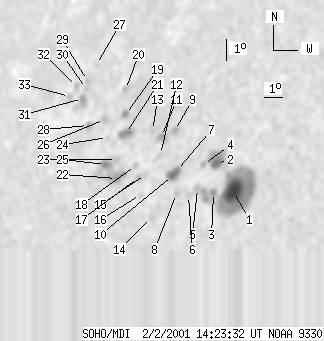
SOHO MDI 2001-02-02 14:23:32 UT
| group | Proj. U | Proj. WS | Corr. U | Corr. WS | B | L | LCM | Pos. angle | r | MU | MP |
| 75 | 518 | 51 | 366 | 25.07 | 114.04 | -33.92 | 45.11 | 0.7130 | 602.6 | 142.6 | |
|
previous
or next observation for the same group /
back to the solar disc SOHO MDI 2001-02-02 14:23:32 UT |
| spot | Proj. U | Proj. WS | Corr. U | Corr. WS | B | L | LCM | Pos. angle | r | MU | MP |
| 35 | 199 | 23 | 133 | 23.68 | 117.46 | -30.50 | 43.89 | 0.6729 | 1442.5 | 674.8 | |
| 8 | 40 | 5 | 27 | 24.99 | 116.26 | -31.70 | 43.50 | 0.6944 | 841.6 | 266.7 | |
| 3 | 23 | 2 | 16 | 23.69 | 116.47 | -31.49 | 44.75 | 0.6818 | 829.1 | 749.9 | |
| 0 | 4 | 0 | 3 | 24.98 | 115.61 | -32.35 | 44.05 | 0.7000 | 283.0 | 238.7 | |
| 0 | 8 | 0 | 5 | 23.92 | 115.62 | -32.34 | 45.22 | 0.6913 | 616.0 | 660.0 | |
| 0 | 5 | 0 | 3 | 23.63 | 115.25 | -32.71 | 45.85 | 0.6923 | 541.0 | 462.3 | |
| 3 | 25 | 2 | 18 | 24.80 | 114.30 | -33.66 | 45.33 | 0.7099 | 532.2 | 389.8 | |
| 0 | 4 | 0 | 3 | 23.76 | 114.61 | -33.35 | 46.23 | 0.6991 | 518.0 | 415.5 | |
| 0 | 6 | 0 | 5 | 26.63 | 113.60 | -34.36 | 43.90 | 0.7299 | -865.0 | -684.5 | |
| 8 | -7 | 6 | -7 | 24.58 | 114.16 | -33.80 | 45.68 | 0.7094 | 609.3 | 999999 | |
| 0 | 12 | 0 | 8 | 26.40 | 113.00 | -34.96 | 44.61 | 0.7331 | 45.0 | -347.6 | |
| 0 | 4 | 0 | 3 | 25.58 | 113.23 | -34.73 | 45.32 | 0.7251 | -691.0 | -499.8 | |
| 0 | 6 | 0 | 4 | 26.71 | 112.42 | -35.54 | 44.73 | 0.7403 | -430.0 | -330.9 | |
| 0 | 3 | 0 | 2 | 22.77 | 113.64 | -34.32 | 48.14 | 0.7004 | 611.0 | 511.8 | |
| 0 | 3 | 0 | 2 | 24.72 | 112.73 | -35.23 | 46.64 | 0.7230 | 444.0 | 381.5 | |
| 0 | 3 | 0 | 2 | 23.84 | 112.76 | -35.20 | 47.61 | 0.7163 | 353.0 | 413.4 | |
| 0 | 6 | 0 | 4 | 24.61 | 112.41 | -35.55 | 47.01 | 0.7250 | 449.0 | 350.1 | |
| 0 | 3 | 0 | 2 | 25.16 | 112.06 | -35.90 | 46.66 | 0.7320 | 89.0 | 86.3 | |
| 3 | 9 | 2 | 7 | 27.56 | 110.64 | -37.32 | 45.13 | 0.7607 | 293.9 | 163.9 | |
| 0 | 6 | 0 | 5 | 28.74 | 110.15 | -37.81 | 44.25 | 0.7726 | -621.0 | -632.8 | |
| 7 | 21 | 5 | 15 | 26.67 | 110.99 | -36.97 | 45.82 | 0.7517 | -977.2 | -750.0 | |
| 3 | 63 | 2 | 47 | 24.64 | 111.24 | -36.72 | 47.84 | 0.7355 | -525.7 | -542.3 | |
| 0 | 6 | 0 | 5 | 25.51 | 110.94 | -37.02 | 47.11 | 0.7441 | -478.0 | -464.7 | |
| 0 | 4 | 0 | 3 | 26.56 | 110.06 | -37.90 | 46.60 | 0.7586 | -562.0 | -524.3 | |
| 5 | -22 | 4 | -22 | 25.32 | 110.42 | -37.54 | 47.68 | 0.7473 | -1013.5 | 999999 | |
| 0 | 6 | 0 | 5 | 27.41 | 109.55 | -38.41 | 46.05 | 0.7684 | -736.0 | -581.1 | |
| 0 | 3 | 0 | 2 | 30.07 | 107.90 | -40.06 | 44.41 | 0.7983 | -431.0 | -390.7 | |
| 0 | 8 | 0 | 6 | 27.19 | 108.75 | -39.21 | 46.82 | 0.7734 | -674.0 | -587.5 | |
| 0 | 4 | 0 | 3 | 29.34 | 107.73 | -40.23 | 45.26 | 0.7949 | -487.0 | -437.9 | |
| 0 | 3 | 0 | 3 | 28.96 | 107.85 | -40.11 | 45.57 | 0.7916 | -416.0 | -488.6 | |
| 0 | 21 | 0 | 17 | 28.49 | 107.84 | -40.12 | 46.06 | 0.7889 | -608.0 | -628.6 | |
| 0 | 4 | 0 | 3 | 29.10 | 107.21 | -40.75 | 45.84 | 0.7974 | -177.0 | -181.0 | |
| 0 | 6 | 0 | 5 | 28.65 | 107.02 | -40.94 | 46.42 | 0.7961 | -441.0 | -339.2 | |
| Proj. U | - Projected umbra area in millionths of solar disc, negative values indicate | |
|
that the umbra consists of fragmented regions which cannot be separated without losing umbral area. In this way several spots (intensity minima in the umbra) have a common umbra, e.g. -2 means that the given spot shares an umbra with spot No.2, and the common U value is indicated at spot No.2. |
||
| Proj. WS | - Projected whole spot area in millionths of solar disc, negative values indicate | |
|
that several umbras have a common penumbra, e.g. -7 means that the given umbra shares a penumbra with umbra No.7, and the WS value is indicated at No.7. |
||
| Corr. U | - Corrected umbra area in millionths of solar hemisphere, for negative values see above | |
| Corr. WS | - Corrected whole spot area in millionths of solar hemisphere, for negative values see above | |
| B | - Heliographic latitude B; positive: North, negative: South | |
| L | - Heliographic longitude L | |
| LCM | - Longitudinal distance from the Sun's central meridian | |
| Pos. angle | - Position angle | |
| r | - Distance from the centre of Sun's disc in terms of Sun's radius | |
| MU | - Mean magnetic field within the umbra contour averaged the pixel values with sign. | |
| MP | - Mean magnetic field within the penumbra contour averaged the pixel values with sign. | |