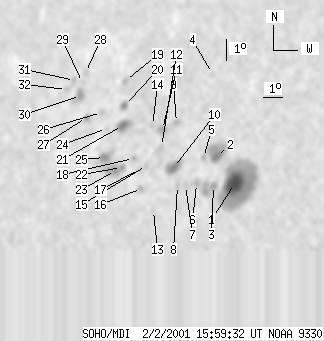
SOHO MDI 2001-02-02 15:59:32 UT
| group | Proj. U | Proj. WS | Corr. U | Corr. WS | B | L | LCM | Pos. angle | r | MU | MP |
| 81 | 522 | 56 | 365 | 24.98 | 114.28 | -32.80 | 44.29 | 0.7028 | 450.6 | 159.4 | |
|
previous
or next observation for the same group /
back to the solar disc SOHO MDI 2001-02-02 15:59:32 UT |
| spot | Proj. U | Proj. WS | Corr. U | Corr. WS | B | L | LCM | Pos. angle | r | MU | MP |
| 34 | 210 | 22 | 139 | 23.72 | 117.44 | -29.64 | 43.06 | 0.6656 | 1441.5 | 653.7 | |
| 9 | 41 | 6 | 28 | 24.98 | 116.22 | -30.86 | 42.76 | 0.6871 | 815.8 | 188.4 | |
| 2 | 26 | 1 | 17 | 23.69 | 116.43 | -30.66 | 44.01 | 0.6744 | 777.8 | 742.3 | |
| 0 | 3 | 0 | 2 | 28.84 | 114.81 | -32.27 | 39.95 | 0.7308 | 427.0 | 306.7 | |
| 0 | 5 | 0 | 3 | 24.98 | 115.58 | -31.50 | 43.33 | 0.6926 | 287.0 | 210.5 | |
| 0 | 6 | 0 | 4 | 23.83 | 115.56 | -31.53 | 44.63 | 0.6833 | 833.0 | 696.4 | |
| 0 | 5 | 0 | 4 | 23.77 | 115.03 | -32.05 | 45.14 | 0.6876 | 638.0 | 589.8 | |
| 0 | 5 | 0 | 4 | 23.79 | 114.62 | -32.46 | 45.46 | 0.6914 | 540.0 | 466.0 | |
| 0 | 6 | 0 | 5 | 26.66 | 113.69 | -33.39 | 43.10 | 0.7222 | -780.0 | -715.1 | |
| 9 | 23 | 7 | 16 | 24.62 | 114.18 | -32.90 | 44.91 | 0.7018 | 606.6 | 427.1 | |
| 0 | 11 | 0 | 8 | 26.39 | 113.06 | -34.02 | 43.90 | 0.7253 | -517.0 | -391.4 | |
| 0 | 8 | 0 | 6 | 25.61 | 113.27 | -33.82 | 44.57 | 0.7175 | -623.0 | -265.2 | |
| 0 | 4 | 0 | 3 | 22.76 | 113.72 | -33.36 | 47.39 | 0.6915 | 580.0 | 520.3 | |
| 0 | 5 | 0 | 4 | 26.61 | 112.47 | -34.62 | 44.13 | 0.7319 | -463.0 | -347.4 | |
| 0 | 4 | 0 | 3 | 24.79 | 112.76 | -34.32 | 45.86 | 0.7157 | 519.0 | 392.8 | |
| 0 | 4 | 0 | 3 | 23.78 | 112.82 | -34.26 | 46.95 | 0.7075 | 410.0 | 358.9 | |
| 0 | 4 | 0 | 3 | 24.64 | 112.45 | -34.63 | 46.28 | 0.7172 | 356.0 | 283.2 | |
| 0 | 4 | 0 | 3 | 25.16 | 111.97 | -35.11 | 46.07 | 0.7252 | 215.0 | 124.4 | |
| 0 | 5 | 0 | 4 | 28.82 | 110.18 | -36.90 | 43.53 | 0.7662 | -775.0 | -673.2 | |
| 4 | 10 | 3 | 7 | 27.64 | 110.60 | -36.48 | 44.44 | 0.7546 | 231.5 | 60.5 | |
| 9 | 22 | 7 | 16 | 26.71 | 110.84 | -36.24 | 45.24 | 0.7460 | -1060.7 | -820.2 | |
| 2 | 61 | 1 | 44 | 24.79 | 111.47 | -35.62 | 46.86 | 0.7269 | 290.0 | -574.3 | |
| 3 | -22 | 2 | -22 | 24.68 | 111.19 | -35.89 | 47.19 | 0.7285 | -485.5 | 999999 | |
| 0 | 3 | 0 | 2 | 26.63 | 110.01 | -37.07 | 45.93 | 0.7523 | -625.0 | -562.5 | |
| 6 | -22 | 4 | -22 | 25.31 | 110.40 | -36.69 | 47.08 | 0.7399 | -1025.5 | 999999 | |
| 0 | 4 | 0 | 3 | 27.40 | 109.44 | -37.64 | 45.52 | 0.7622 | -734.0 | -629.9 | |
| 0 | 8 | 0 | 6 | 27.23 | 108.69 | -38.39 | 46.23 | 0.7671 | -712.0 | -577.3 | |
| 0 | 6 | 0 | 5 | 29.37 | 107.70 | -39.38 | 44.68 | 0.7888 | -618.0 | -448.5 | |
| 0 | 2 | 0 | 2 | 28.90 | 107.74 | -39.34 | 45.12 | 0.7855 | -563.0 | -518.4 | |
| 3 | 18 | 3 | 14 | 28.29 | 107.90 | -39.18 | 45.65 | 0.7803 | -820.6 | -615.7 | |
| 0 | 5 | 0 | 4 | 29.03 | 107.22 | -39.86 | 45.33 | 0.7902 | -255.0 | -202.2 | |
| 0 | 4 | 0 | 3 | 28.63 | 106.95 | -40.13 | 45.92 | 0.7899 | -353.0 | -391.4 | |
| Proj. U | - Projected umbra area in millionths of solar disc, negative values indicate | |
|
that the umbra consists of fragmented regions which cannot be separated without losing umbral area. In this way several spots (intensity minima in the umbra) have a common umbra, e.g. -2 means that the given spot shares an umbra with spot No.2, and the common U value is indicated at spot No.2. |
||
| Proj. WS | - Projected whole spot area in millionths of solar disc, negative values indicate | |
|
that several umbras have a common penumbra, e.g. -7 means that the given umbra shares a penumbra with umbra No.7, and the WS value is indicated at No.7. |
||
| Corr. U | - Corrected umbra area in millionths of solar hemisphere, for negative values see above | |
| Corr. WS | - Corrected whole spot area in millionths of solar hemisphere, for negative values see above | |
| B | - Heliographic latitude B; positive: North, negative: South | |
| L | - Heliographic longitude L | |
| LCM | - Longitudinal distance from the Sun's central meridian | |
| Pos. angle | - Position angle | |
| r | - Distance from the centre of Sun's disc in terms of Sun's radius | |
| MU | - Mean magnetic field within the umbra contour averaged the pixel values with sign. | |
| MP | - Mean magnetic field within the penumbra contour averaged the pixel values with sign. | |