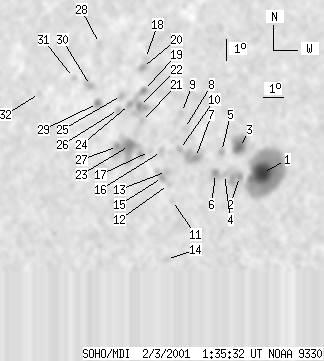
SOHO MDI 2001-02-03 01:35:32 UT
| group | Proj. U | Proj. WS | Corr. U | Corr. WS | B | L | LCM | Pos. angle | r | MU | MP |
| 62 | 568 | 42 | 373 | 24.87 | 113.95 | -27.86 | 39.91 | 0.6602 | 551.4 | 160.8 | |
|
previous
or next observation for the same group /
back to the solar disc SOHO MDI 2001-02-03 01:35:32 UT |
| spot | Proj. U | Proj. WS | Corr. U | Corr. WS | B | L | LCM | Pos. angle | r | MU | MP |
| 28 | 214 | 18 | 135 | 23.68 | 117.40 | -24.42 | 37.77 | 0.6203 | 1493.1 | 657.8 | |
| 0 | 21 | 0 | 13 | 23.56 | 116.36 | -25.45 | 39.04 | 0.6278 | 764.0 | 736.6 | |
| 11 | 34 | 7 | 22 | 24.86 | 116.08 | -25.73 | 37.94 | 0.6431 | 859.7 | 353.0 | |
| 0 | 4 | 0 | 2 | 23.68 | 115.63 | -26.18 | 39.67 | 0.6352 | 705.0 | 650.2 | |
| 0 | 7 | 0 | 4 | 24.72 | 115.26 | -26.55 | 38.93 | 0.6485 | 329.0 | 219.1 | |
| 2 | 13 | 2 | 8 | 23.75 | 115.20 | -26.61 | 40.05 | 0.6396 | 876.2 | 763.4 | |
| 0 | 27 | 0 | 18 | 24.51 | 114.07 | -27.74 | 40.34 | 0.6565 | 703.0 | 277.0 | |
| 0 | 7 | 0 | 4 | 25.86 | 113.20 | -28.61 | 39.75 | 0.6762 | -465.0 | -331.8 | |
| 0 | 6 | 0 | 4 | 26.60 | 112.85 | -28.96 | 39.30 | 0.6858 | -791.0 | -609.2 | |
| 0 | 6 | 0 | 4 | 24.92 | 113.21 | -28.61 | 40.75 | 0.6676 | 484.0 | 400.3 | |
| 0 | 4 | 0 | 3 | 22.66 | 113.42 | -28.40 | 43.05 | 0.6452 | 575.0 | 478.8 | |
| 0 | 5 | 0 | 3 | 23.38 | 113.06 | -28.75 | 42.58 | 0.6549 | 427.0 | 358.8 | |
| 0 | 8 | 0 | 5 | 23.96 | 112.82 | -28.99 | 42.15 | 0.6623 | 586.0 | 439.9 | |
| 0 | 5 | 0 | 3 | 20.10 | 113.68 | -28.14 | 45.83 | 0.6197 | 582.0 | 479.0 | |
| 0 | 12 | 0 | 8 | 23.71 | 112.69 | -29.12 | 42.56 | 0.6611 | 729.0 | 465.7 | |
| 0 | 7 | 0 | 5 | 24.88 | 112.34 | -29.47 | 41.60 | 0.6746 | 417.0 | 328.6 | |
| 0 | 2 | 0 | 2 | 24.91 | 111.75 | -30.06 | 42.11 | 0.6799 | 186.0 | 178.1 | |
| 0 | 5 | 0 | 3 | 29.24 | 110.22 | -31.59 | 38.97 | 0.7292 | -676.0 | -645.7 | |
| 3 | 11 | 2 | 8 | 27.73 | 110.62 | -31.19 | 40.14 | 0.7135 | 231.2 | 31.0 | |
| 0 | 8 | 0 | 6 | 28.82 | 110.21 | -31.60 | 39.39 | 0.7258 | -603.0 | -638.5 | |
| 0 | 4 | 0 | 3 | 26.30 | 110.96 | -30.85 | 41.33 | 0.6986 | -600.0 | -534.6 | |
| 3 | 21 | 2 | 15 | 27.00 | 110.65 | -31.16 | 40.87 | 0.7071 | -944.1 | -817.4 | |
| 10 | 85 | 7 | 58 | 25.24 | 110.67 | -31.14 | 42.71 | 0.6920 | -511.5 | -479.5 | |
| 0 | 12 | 0 | 8 | 27.13 | 110.10 | -31.71 | 41.21 | 0.7125 | -746.0 | -619.3 | |
| 0 | 5 | 0 | 4 | 27.57 | 109.55 | -32.26 | 41.21 | 0.7206 | -688.0 | -674.1 | |
| 0 | 6 | 0 | 4 | 26.93 | 109.61 | -32.20 | 41.83 | 0.7149 | -821.0 | -718.7 | |
| 2 | -23 | 2 | -23 | 25.23 | 110.08 | -31.73 | 43.23 | 0.6970 | -1015.9 | 999999 | |
| 0 | 2 | 0 | 2 | 30.12 | 107.47 | -34.34 | 40.31 | 0.7567 | -630.0 | -549.1 | |
| 3 | 8 | 2 | 5 | 27.28 | 108.41 | -33.40 | 42.45 | 0.7273 | -783.2 | -571.6 | |
| 0 | 13 | 0 | 9 | 28.14 | 107.74 | -34.07 | 42.08 | 0.7394 | -792.0 | -613.5 | |
| 0 | 3 | 0 | 2 | 28.58 | 106.67 | -35.14 | 42.45 | 0.7511 | -429.0 | -396.1 | |
| 0 | 3 | 0 | 3 | 27.95 | 105.09 | -36.73 | 44.28 | 0.7590 | -415.0 | -385.4 | |
| Proj. U | - Projected umbra area in millionths of solar disc, negative values indicate | |
|
that the umbra consists of fragmented regions which cannot be separated without losing umbral area. In this way several spots (intensity minima in the umbra) have a common umbra, e.g. -2 means that the given spot shares an umbra with spot No.2, and the common U value is indicated at spot No.2. |
||
| Proj. WS | - Projected whole spot area in millionths of solar disc, negative values indicate | |
|
that several umbras have a common penumbra, e.g. -7 means that the given umbra shares a penumbra with umbra No.7, and the WS value is indicated at No.7. |
||
| Corr. U | - Corrected umbra area in millionths of solar hemisphere, for negative values see above | |
| Corr. WS | - Corrected whole spot area in millionths of solar hemisphere, for negative values see above | |
| B | - Heliographic latitude B; positive: North, negative: South | |
| L | - Heliographic longitude L | |
| LCM | - Longitudinal distance from the Sun's central meridian | |
| Pos. angle | - Position angle | |
| r | - Distance from the centre of Sun's disc in terms of Sun's radius | |
| MU | - Mean magnetic field within the umbra contour averaged the pixel values with sign. | |
| MP | - Mean magnetic field within the penumbra contour averaged the pixel values with sign. | |