SOHO MDI 2001-02-03 04:47:32 UT
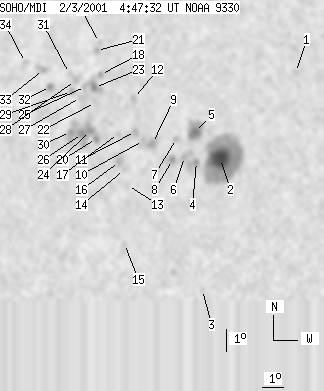
| group | Proj. U | Proj. WS | Corr. U | Corr. WS | B | L | LCM | Pos. angle | r | MU | MP |
| 64 | 541 | 41 | 352 | 24.72 | 114.35 | -25.71 | 37.87 | 0.6411 | 672.0 | 193.7 | |
|
previous
or next observation for the same group /
back to the solar disc SOHO MDI 2001-02-03 04:47:32 UT |
| spot | Proj. U | Proj. WS | Corr. U | Corr. WS | B | L | LCM | Pos. angle | r | MU | MP |
| 0 | 6 | 0 | 4 | 27.39 | 120.11 | -19.94 | 28.98 | 0.6274 | -152.0 | -187.2 | |
| 30 | 223 | 19 | 139 | 23.64 | 117.39 | -22.67 | 35.82 | 0.6055 | 1536.6 | 637.5 | |
| 0 | 3 | 0 | 2 | 18.01 | 117.48 | -22.57 | 42.29 | 0.5447 | 389.0 | 293.6 | |
| 0 | 17 | 0 | 11 | 23.56 | 116.31 | -23.75 | 37.15 | 0.6135 | 712.0 | 754.1 | |
| 12 | 37 | 8 | 23 | 24.86 | 115.95 | -24.10 | 36.18 | 0.6300 | 863.8 | 263.9 | |
| 0 | 10 | 0 | 7 | 23.80 | 115.71 | -24.35 | 37.56 | 0.6211 | 694.0 | 567.9 | |
| 0 | 4 | 0 | 3 | 24.63 | 115.17 | -24.89 | 37.28 | 0.6340 | 384.0 | 221.7 | |
| 2 | 10 | 1 | 6 | 23.70 | 115.18 | -24.88 | 38.26 | 0.6244 | 858.9 | 766.8 | |
| 0 | 12 | 0 | 8 | 24.46 | 114.08 | -25.97 | 38.61 | 0.6412 | 459.0 | 535.8 | |
| 0 | 9 | 0 | 6 | 24.62 | 113.62 | -26.43 | 38.91 | 0.6466 | -169.0 | 43.5 | |
| 0 | 16 | 0 | 10 | 25.04 | 113.14 | -26.91 | 38.95 | 0.6547 | 480.0 | 446.8 | |
| 0 | 6 | 0 | 4 | 26.55 | 112.67 | -27.38 | 37.85 | 0.6729 | -766.0 | -616.4 | |
| 0 | 4 | 0 | 3 | 22.65 | 113.31 | -26.75 | 41.40 | 0.6304 | 501.0 | 478.0 | |
| 0 | 3 | 0 | 2 | 23.37 | 113.01 | -27.05 | 40.90 | 0.6398 | 384.0 | 341.9 | |
| 0 | 3 | 0 | 2 | 20.13 | 113.66 | -26.39 | 44.00 | 0.6031 | 741.0 | 614.6 | |
| 0 | 11 | 0 | 7 | 23.73 | 112.69 | -27.36 | 40.81 | 0.6461 | 753.0 | 507.4 | |
| 0 | 4 | 0 | 3 | 24.99 | 112.34 | -27.71 | 39.79 | 0.6609 | 382.0 | 317.3 | |
| 0 | 6 | 0 | 4 | 27.76 | 110.72 | -29.34 | 38.47 | 0.6993 | 466.0 | 270.2 | |
| 0 | 3 | 0 | 2 | 29.27 | 110.20 | -29.86 | 37.45 | 0.7167 | -783.0 | -636.5 | |
| 3 | 78 | 2 | 52 | 24.83 | 111.33 | -28.73 | 40.95 | 0.6679 | 573.0 | -475.4 | |
| 0 | 6 | 0 | 4 | 28.90 | 110.16 | -29.89 | 37.84 | 0.7136 | -845.0 | -634.4 | |
| 0 | 4 | 0 | 3 | 26.47 | 110.84 | -29.21 | 39.67 | 0.6868 | -654.0 | -557.7 | |
| 4 | 18 | 3 | 13 | 27.17 | 110.59 | -29.46 | 39.18 | 0.6950 | -912.4 | -596.0 | |
| 3 | -20 | 2 | -20 | 25.21 | 110.94 | -29.12 | 40.91 | 0.6746 | 217.1 | 999999 | |
| 0 | 4 | 0 | 3 | 27.24 | 110.12 | -29.93 | 39.53 | 0.6994 | -722.0 | -672.5 | |
| 5 | -20 | 3 | -20 | 25.09 | 110.58 | -29.47 | 41.37 | 0.6766 | -648.5 | 999999 | |
| 0 | 4 | 0 | 3 | 26.75 | 110.02 | -30.03 | 40.13 | 0.6958 | -850.0 | -801.2 | |
| 0 | 6 | 0 | 5 | 27.55 | 109.53 | -30.53 | 39.74 | 0.7068 | -922.0 | -784.7 | |
| 0 | 6 | 0 | 4 | 27.05 | 109.48 | -30.57 | 40.30 | 0.7028 | -862.0 | -808.1 | |
| 2 | -20 | 1 | -20 | 25.22 | 109.96 | -30.09 | 41.80 | 0.6830 | -1005.8 | 999999 | |
| 0 | 3 | 0 | 2 | 27.90 | 109.12 | -30.94 | 39.75 | 0.7130 | -478.0 | -484.8 | |
| 3 | 9 | 2 | 6 | 27.35 | 108.33 | -31.73 | 40.99 | 0.7146 | -767.4 | -602.2 | |
| 0 | 12 | 0 | 8 | 28.17 | 107.70 | -32.36 | 40.68 | 0.7263 | -760.0 | -518.6 | |
| 0 | 4 | 0 | 3 | 28.56 | 106.62 | -33.43 | 41.15 | 0.7378 | -439.0 | -364.3 | |
| Proj. U | - Projected umbra area in millionths of solar disc, negative values indicate | |
|
that the umbra consists of fragmented regions which cannot be separated without losing umbral area. In this way several spots (intensity minima in the umbra) have a common umbra, e.g. -2 means that the given spot shares an umbra with spot No.2, and the common U value is indicated at spot No.2. |
||
| Proj. WS | - Projected whole spot area in millionths of solar disc, negative values indicate | |
|
that several umbras have a common penumbra, e.g. -7 means that the given umbra shares a penumbra with umbra No.7, and the WS value is indicated at No.7. |
||
| Corr. U | - Corrected umbra area in millionths of solar hemisphere, for negative values see above | |
| Corr. WS | - Corrected whole spot area in millionths of solar hemisphere, for negative values see above | |
| B | - Heliographic latitude B; positive: North, negative: South | |
| L | - Heliographic longitude L | |
| LCM | - Longitudinal distance from the Sun's central meridian | |
| Pos. angle | - Position angle | |
| r | - Distance from the centre of Sun's disc in terms of Sun's radius | |
| MU | - Mean magnetic field within the umbra contour averaged the pixel values with sign. | |
| MP | - Mean magnetic field within the penumbra contour averaged the pixel values with sign. | |