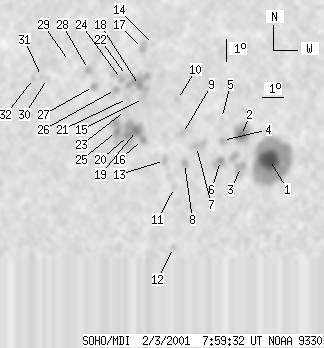
SOHO MDI 2001-02-03 07:59:32 UT
| group | Proj. U | Proj. WS | Corr. U | Corr. WS | B | L | LCM | Pos. angle | r | MU | MP |
| 68 | 598 | 42 | 383 | 24.85 | 113.89 | -24.41 | 36.30 | 0.6320 | 822.9 | 133.8 | |
|
previous
or next observation for the same group /
back to the solar disc SOHO MDI 2001-02-03 07:59:32 UT |
| spot | Proj. U | Proj. WS | Corr. U | Corr. WS | B | L | LCM | Pos. angle | r | MU | MP |
| 36 | 223 | 22 | 137 | 23.65 | 117.38 | -20.92 | 33.69 | 0.5918 | 1535.7 | 612.2 | |
| 11 | 35 | 7 | 22 | 24.77 | 115.91 | -22.39 | 34.32 | 0.6157 | 892.1 | 341.6 | |
| 0 | 41 | 0 | 25 | 23.39 | 116.17 | -22.13 | 35.44 | 0.5986 | 1021.0 | 692.4 | |
| 0 | 6 | 0 | 4 | 24.59 | 115.08 | -23.22 | 35.47 | 0.6202 | 298.0 | 284.8 | |
| 0 | 2 | 0 | 1 | 25.58 | 114.83 | -23.47 | 34.74 | 0.6327 | 301.0 | 217.4 | |
| 2 | 15 | 2 | 10 | 23.70 | 115.16 | -23.14 | 36.30 | 0.6101 | 859.0 | 804.3 | |
| 0 | 17 | 0 | 11 | 24.38 | 113.92 | -24.38 | 36.98 | 0.6273 | 378.0 | 457.0 | |
| 0 | 7 | 0 | 5 | 23.64 | 113.51 | -24.78 | 38.21 | 0.6232 | 669.0 | 456.6 | |
| 0 | 7 | 0 | 5 | 24.99 | 113.14 | -25.16 | 37.18 | 0.6400 | 618.0 | 401.6 | |
| 0 | 5 | 0 | 3 | 26.55 | 112.54 | -25.76 | 36.22 | 0.6603 | -761.0 | -579.1 | |
| 0 | 5 | 0 | 3 | 22.60 | 113.26 | -25.04 | 39.63 | 0.6149 | 567.0 | 498.2 | |
| 0 | 4 | 0 | 2 | 20.00 | 113.69 | -24.61 | 42.20 | 0.5848 | 700.0 | 563.8 | |
| 0 | 6 | 0 | 4 | 23.82 | 112.55 | -25.75 | 39.05 | 0.6331 | 628.0 | 456.1 | |
| 0 | 3 | 0 | 2 | 29.19 | 110.67 | -27.63 | 35.49 | 0.6997 | -595.0 | -494.4 | |
| 0 | 7 | 0 | 5 | 26.69 | 110.87 | -27.43 | 37.75 | 0.6746 | -582.0 | -493.2 | |
| 2 | 104 | 1 | 68 | 24.82 | 111.29 | -27.01 | 39.28 | 0.6534 | 700.0 | -459.0 | |
| 0 | 10 | 0 | 7 | 29.03 | 110.17 | -28.13 | 36.11 | 0.7019 | -894.0 | -698.9 | |
| 2 | 36 | 1 | 25 | 27.30 | 110.51 | -27.78 | 37.48 | 0.6831 | -1021.2 | -485.4 | |
| 8 | -16 | 5 | -16 | 25.24 | 110.90 | -27.40 | 39.22 | 0.6607 | 288.3 | 999999 | |
| 4 | -16 | 2 | -16 | 25.04 | 110.57 | -27.73 | 39.76 | 0.6615 | -560.0 | 999999 | |
| 0 | 7 | 0 | 5 | 26.73 | 110.08 | -28.22 | 38.47 | 0.6812 | -895.0 | -794.7 | |
| 0 | 2 | 0 | 1 | 27.80 | 109.73 | -28.56 | 37.71 | 0.6938 | -658.0 | -581.0 | |
| 0 | 6 | 0 | 4 | 26.18 | 110.13 | -28.17 | 38.98 | 0.6758 | -701.0 | -597.8 | |
| 0 | 14 | 0 | 9 | 27.63 | 109.54 | -28.76 | 38.07 | 0.6937 | -821.0 | -591.6 | |
| 3 | -16 | 2 | -16 | 25.25 | 109.94 | -28.36 | 40.14 | 0.6687 | -1109.6 | 999999 | |
| 0 | 11 | 0 | 8 | 27.18 | 109.37 | -28.93 | 38.68 | 0.6910 | -1003.0 | -671.3 | |
| 0 | 8 | 0 | 6 | 27.38 | 108.22 | -30.08 | 39.52 | 0.7019 | -820.0 | -669.7 | |
| 0 | 6 | 0 | 4 | 28.19 | 107.71 | -30.59 | 39.14 | 0.7128 | -703.0 | -608.6 | |
| 0 | 2 | 0 | 1 | 28.63 | 106.60 | -31.70 | 39.66 | 0.7251 | -417.0 | -348.3 | |
| 0 | 3 | 0 | 2 | 27.90 | 105.71 | -32.59 | 41.13 | 0.7260 | -500.0 | -432.1 | |
| 0 | 2 | 0 | 1 | 28.01 | 105.36 | -32.94 | 41.30 | 0.7297 | -395.0 | -432.5 | |
| 0 | 4 | 0 | 3 | 27.95 | 104.97 | -33.33 | 41.68 | 0.7322 | -534.0 | -483.5 | |
| Proj. U | - Projected umbra area in millionths of solar disc, negative values indicate | |
|
that the umbra consists of fragmented regions which cannot be separated without losing umbral area. In this way several spots (intensity minima in the umbra) have a common umbra, e.g. -2 means that the given spot shares an umbra with spot No.2, and the common U value is indicated at spot No.2. |
||
| Proj. WS | - Projected whole spot area in millionths of solar disc, negative values indicate | |
|
that several umbras have a common penumbra, e.g. -7 means that the given umbra shares a penumbra with umbra No.7, and the WS value is indicated at No.7. |
||
| Corr. U | - Corrected umbra area in millionths of solar hemisphere, for negative values see above | |
| Corr. WS | - Corrected whole spot area in millionths of solar hemisphere, for negative values see above | |
| B | - Heliographic latitude B; positive: North, negative: South | |
| L | - Heliographic longitude L | |
| LCM | - Longitudinal distance from the Sun's central meridian | |
| Pos. angle | - Position angle | |
| r | - Distance from the centre of Sun's disc in terms of Sun's radius | |
| MU | - Mean magnetic field within the umbra contour averaged the pixel values with sign. | |
| MP | - Mean magnetic field within the penumbra contour averaged the pixel values with sign. | |