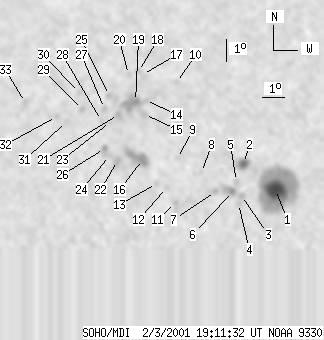
SOHO MDI 2001-02-03 19:11:32 UT
| group | Proj. U | Proj. WS | Corr. U | Corr. WS | B | L | LCM | Pos. angle | r | MU | MP |
| 52 | 469 | 31 | 286 | 24.96 | 113.88 | -18.27 | 28.69 | 0.5881 | 993.7 | 167.0 | |
|
previous
or next observation for the same group /
back to the solar disc SOHO MDI 2001-02-03 19:11:32 UT |
| spot | Proj. U | Proj. WS | Corr. U | Corr. WS | B | L | LCM | Pos. angle | r | MU | MP |
| 30 | 210 | 18 | 124 | 23.53 | 117.32 | -14.83 | 25.47 | 0.5477 | 1684.8 | 620.2 | |
| 7 | 21 | 4 | 12 | 24.74 | 115.78 | -16.37 | 26.66 | 0.5728 | 870.5 | 596.1 | |
| 0 | 4 | 0 | 3 | 23.32 | 115.87 | -16.27 | 27.78 | 0.5543 | 911.0 | 732.0 | |
| 0 | 5 | 0 | 3 | 22.97 | 115.79 | -16.36 | 28.23 | 0.5505 | 785.0 | 690.6 | |
| 0 | 5 | 0 | 3 | 23.94 | 115.57 | -16.57 | 27.64 | 0.5642 | 638.0 | 560.4 | |
| 4 | 16 | 2 | 9 | 23.51 | 115.46 | -16.69 | 28.20 | 0.5595 | 1133.3 | 820.3 | |
| 0 | 4 | 0 | 2 | 23.53 | 114.71 | -17.44 | 29.23 | 0.5650 | 927.0 | 739.5 | |
| 0 | 3 | 0 | 2 | 24.40 | 113.97 | -18.18 | 29.42 | 0.5807 | 555.0 | 433.2 | |
| 0 | 2 | 0 | 1 | 25.07 | 112.79 | -19.36 | 30.33 | 0.5969 | 567.0 | 608.2 | |
| 0 | 4 | 0 | 3 | 28.57 | 112.11 | -20.04 | 28.07 | 0.6419 | -687.0 | -587.5 | |
| 0 | 7 | 0 | 4 | 23.11 | 113.01 | -19.14 | 31.94 | 0.5723 | 471.0 | 457.4 | |
| 0 | 4 | 0 | 3 | 23.79 | 112.51 | -19.64 | 31.92 | 0.5841 | 528.0 | 385.9 | |
| 0 | 4 | 0 | 2 | 23.98 | 112.03 | -20.12 | 32.33 | 0.5899 | 532.0 | 456.8 | |
| 0 | 4 | 0 | 2 | 27.79 | 110.82 | -21.33 | 30.23 | 0.6415 | 144.0 | 46.7 | |
| 0 | 10 | 0 | 6 | 27.14 | 110.91 | -21.24 | 30.71 | 0.6337 | -952.0 | -818.8 | |
| 7 | 45 | 4 | 28 | 25.09 | 111.21 | -20.94 | 32.27 | 0.6086 | 694.0 | 133.2 | |
| 0 | 1 | 0 | 0 | 29.01 | 110.42 | -21.73 | 29.61 | 0.6576 | -539.0 | -578.7 | |
| 0 | 4 | 0 | 2 | 29.16 | 110.20 | -21.95 | 29.73 | 0.6607 | -684.0 | -626.1 | |
| 4 | 36 | 3 | 23 | 27.76 | 110.36 | -21.79 | 30.77 | 0.6443 | -376.7 | -703.3 | |
| 0 | 4 | 0 | 3 | 29.04 | 109.75 | -22.40 | 30.32 | 0.6623 | -671.0 | -579.7 | |
| 0 | 9 | 0 | 6 | 27.19 | 109.69 | -22.46 | 32.05 | 0.6428 | -1070.0 | -945.1 | |
| 0 | 10 | 0 | 6 | 25.09 | 110.07 | -22.08 | 33.62 | 0.6172 | -821.0 | -782.4 | |
| 0 | 3 | 0 | 2 | 26.89 | 109.38 | -22.77 | 32.68 | 0.6417 | -661.0 | -616.8 | |
| 0 | 1 | 0 | 1 | 25.33 | 109.65 | -22.50 | 33.86 | 0.6230 | -829.0 | -804.5 | |
| 0 | 15 | 0 | 10 | 28.09 | 109.07 | -23.08 | 31.90 | 0.6568 | -521.0 | -600.0 | |
| 0 | 9 | 0 | 6 | 25.66 | 109.36 | -22.79 | 33.88 | 0.6287 | -703.0 | -566.8 | |
| 0 | 5 | 0 | 3 | 27.50 | 108.96 | -23.18 | 32.56 | 0.6512 | -771.0 | -676.7 | |
| 0 | 5 | 0 | 3 | 26.95 | 108.95 | -23.20 | 33.10 | 0.6455 | -750.0 | -598.4 | |
| 0 | 4 | 0 | 3 | 27.50 | 107.92 | -24.23 | 33.68 | 0.6587 | -624.0 | -576.0 | |
| 0 | 4 | 0 | 3 | 28.30 | 107.59 | -24.56 | 33.28 | 0.6694 | -507.0 | -458.4 | |
| 0 | 3 | 0 | 2 | 26.98 | 107.29 | -24.86 | 34.84 | 0.6581 | -748.0 | -763.4 | |
| 0 | 4 | 0 | 3 | 27.24 | 106.75 | -25.40 | 35.15 | 0.6647 | -778.0 | -698.0 | |
| 0 | 4 | 0 | 3 | 27.97 | 105.06 | -27.09 | 36.13 | 0.6845 | -506.0 | -603.0 | |
| Proj. U | - Projected umbra area in millionths of solar disc, negative values indicate | |
|
that the umbra consists of fragmented regions which cannot be separated without losing umbral area. In this way several spots (intensity minima in the umbra) have a common umbra, e.g. -2 means that the given spot shares an umbra with spot No.2, and the common U value is indicated at spot No.2. |
||
| Proj. WS | - Projected whole spot area in millionths of solar disc, negative values indicate | |
|
that several umbras have a common penumbra, e.g. -7 means that the given umbra shares a penumbra with umbra No.7, and the WS value is indicated at No.7. |
||
| Corr. U | - Corrected umbra area in millionths of solar hemisphere, for negative values see above | |
| Corr. WS | - Corrected whole spot area in millionths of solar hemisphere, for negative values see above | |
| B | - Heliographic latitude B; positive: North, negative: South | |
| L | - Heliographic longitude L | |
| LCM | - Longitudinal distance from the Sun's central meridian | |
| Pos. angle | - Position angle | |
| r | - Distance from the centre of Sun's disc in terms of Sun's radius | |
| MU | - Mean magnetic field within the umbra contour averaged the pixel values with sign. | |
| MP | - Mean magnetic field within the penumbra contour averaged the pixel values with sign. | |