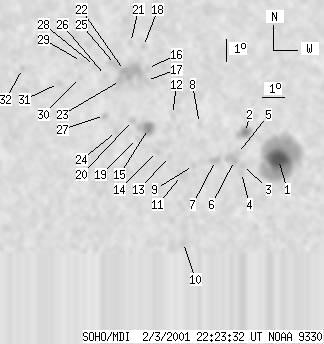
SOHO MDI 2001-02-03 22:23:32 UT
| group | Proj. U | Proj. WS | Corr. U | Corr. WS | B | L | LCM | Pos. angle | r | MU | MP |
| 47 | 450 | 29 | 269 | 24.72 | 114.17 | -16.22 | 26.13 | 0.5718 | 1112.0 | 260.7 | |
|
previous
or next observation for the same group /
back to the solar disc SOHO MDI 2001-02-03 22:23:32 UT |
| spot | Proj. U | Proj. WS | Corr. U | Corr. WS | B | L | LCM | Pos. angle | r | MU | MP |
| 32 | 213 | 19 | 125 | 23.47 | 117.30 | -13.09 | 22.87 | 0.5366 | 1681.1 | 600.4 | |
| 6 | 19 | 4 | 11 | 24.72 | 115.74 | -14.66 | 24.24 | 0.5621 | 850.2 | 630.0 | |
| 0 | 4 | 0 | 2 | 23.25 | 115.78 | -14.62 | 25.39 | 0.5428 | 856.0 | 727.1 | |
| 0 | 4 | 0 | 2 | 22.95 | 115.77 | -14.62 | 25.67 | 0.5388 | 820.0 | 668.2 | |
| 0 | 4 | 0 | 3 | 23.79 | 115.50 | -14.89 | 25.35 | 0.5515 | 805.0 | 720.0 | |
| 0 | 14 | 0 | 8 | 23.48 | 115.40 | -14.99 | 25.75 | 0.5481 | 1154.0 | 896.3 | |
| 0 | 9 | 0 | 5 | 23.51 | 114.58 | -15.82 | 26.94 | 0.5538 | 981.0 | 741.4 | |
| 0 | 3 | 0 | 2 | 25.19 | 113.65 | -16.74 | 26.78 | 0.5809 | 486.0 | 453.3 | |
| 0 | 5 | 0 | 3 | 23.32 | 113.64 | -16.75 | 28.45 | 0.5577 | 827.0 | 631.8 | |
| 0 | 4 | 0 | 2 | 19.98 | 113.61 | -16.78 | 31.85 | 0.5163 | 405.0 | 370.8 | |
| 0 | 15 | 0 | 9 | 22.90 | 113.17 | -17.22 | 29.51 | 0.5557 | 624.0 | 579.8 | |
| 0 | 4 | 0 | 2 | 25.64 | 112.38 | -18.01 | 28.07 | 0.5946 | 350.0 | 259.7 | |
| 0 | 5 | 0 | 3 | 23.76 | 112.53 | -17.86 | 29.59 | 0.5708 | 221.0 | 252.9 | |
| 0 | 4 | 0 | 2 | 24.00 | 111.96 | -18.43 | 30.12 | 0.5778 | 513.0 | 412.5 | |
| 9 | 26 | 6 | 16 | 25.04 | 111.40 | -18.99 | 29.87 | 0.5942 | 620.6 | 332.8 | |
| 0 | 5 | 0 | 3 | 27.79 | 110.88 | -19.52 | 28.10 | 0.6298 | 280.0 | 104.2 | |
| 0 | 5 | 0 | 3 | 27.24 | 110.93 | -19.46 | 28.50 | 0.6230 | -812.0 | -582.6 | |
| 0 | 5 | 0 | 3 | 28.83 | 110.49 | -19.90 | 27.69 | 0.6441 | -791.0 | -664.2 | |
| 0 | 2 | 0 | 1 | 24.61 | 110.98 | -19.41 | 30.82 | 0.5921 | -5.0 | 24.6 | |
| 0 | 4 | 0 | 2 | 25.43 | 110.62 | -19.78 | 30.51 | 0.6042 | 184.0 | 129.8 | |
| 0 | 3 | 0 | 2 | 29.04 | 109.84 | -20.56 | 28.26 | 0.6506 | -683.0 | -533.4 | |
| 0 | 33 | 0 | 21 | 27.74 | 109.82 | -20.57 | 29.39 | 0.6360 | -779.0 | -666.4 | |
| 0 | 12 | 0 | 8 | 27.29 | 109.73 | -20.66 | 29.90 | 0.6315 | -1043.0 | -865.6 | |
| 0 | 5 | 0 | 3 | 24.97 | 109.97 | -20.42 | 31.74 | 0.6035 | -838.0 | -761.6 | |
| 0 | 12 | 0 | 7 | 28.04 | 109.34 | -21.05 | 29.68 | 0.6425 | -676.0 | -602.4 | |
| 0 | 3 | 0 | 2 | 27.55 | 108.98 | -21.41 | 30.53 | 0.6395 | -579.0 | -621.6 | |
| 0 | 5 | 0 | 3 | 25.71 | 109.29 | -21.10 | 31.85 | 0.6169 | -644.0 | -588.9 | |
| 0 | 3 | 0 | 2 | 28.04 | 108.36 | -22.03 | 30.79 | 0.6491 | -693.0 | -564.2 | |
| 0 | 9 | 0 | 6 | 28.25 | 107.70 | -22.69 | 31.33 | 0.6559 | -630.0 | -545.0 | |
| 0 | 3 | 0 | 2 | 27.51 | 107.82 | -22.57 | 31.87 | 0.6471 | -667.0 | -560.4 | |
| 0 | 4 | 0 | 3 | 27.28 | 106.84 | -23.55 | 33.16 | 0.6516 | -737.0 | -634.1 | |
| 0 | 4 | 0 | 3 | 28.06 | 104.93 | -25.46 | 34.42 | 0.6735 | -761.0 | -606.3 | |
| Proj. U | - Projected umbra area in millionths of solar disc, negative values indicate | |
|
that the umbra consists of fragmented regions which cannot be separated without losing umbral area. In this way several spots (intensity minima in the umbra) have a common umbra, e.g. -2 means that the given spot shares an umbra with spot No.2, and the common U value is indicated at spot No.2. |
||
| Proj. WS | - Projected whole spot area in millionths of solar disc, negative values indicate | |
|
that several umbras have a common penumbra, e.g. -7 means that the given umbra shares a penumbra with umbra No.7, and the WS value is indicated at No.7. |
||
| Corr. U | - Corrected umbra area in millionths of solar hemisphere, for negative values see above | |
| Corr. WS | - Corrected whole spot area in millionths of solar hemisphere, for negative values see above | |
| B | - Heliographic latitude B; positive: North, negative: South | |
| L | - Heliographic longitude L | |
| LCM | - Longitudinal distance from the Sun's central meridian | |
| Pos. angle | - Position angle | |
| r | - Distance from the centre of Sun's disc in terms of Sun's radius | |
| MU | - Mean magnetic field within the umbra contour averaged the pixel values with sign. | |
| MP | - Mean magnetic field within the penumbra contour averaged the pixel values with sign. | |