SOHO MDI 2001-09-23 19:11:33 UT
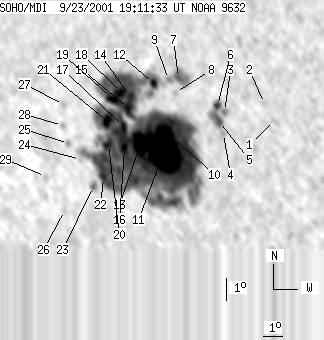
| group | Proj. U | Proj. WS | Corr. U | Corr. WS | B | L | LCM | Pos. angle | r | MU | MP |
| 260 | 1736 | 172 | 1151 | -18.47 | 274.02 | -33.30 | 128.28 | 0.6656 | -576.7 | -200.7 | |
|
previous
or next observation for the same group /
back to the solar disc SOHO MDI 2001-09-23 19:11:33 UT |
| spot | Proj. U | Proj. WS | Corr. U | Corr. WS | B | L | LCM | Pos. angle | r | MU | MP |
| 0 | 7 | 0 | 4 | -17.37 | 280.34 | -26.98 | 132.72 | 0.5915 | 433.0 | 391.3 | |
| 0 | 5 | 0 | 3 | -16.67 | 279.99 | -27.32 | 131.44 | 0.5888 | 739.0 | 686.9 | |
| 0 | 7 | 0 | 4 | -17.13 | 278.07 | -29.25 | 130.13 | 0.6130 | 738.0 | 534.4 | |
| 0 | 5 | 0 | 3 | -18.08 | 277.85 | -29.47 | 131.14 | 0.6233 | -287.0 | -277.4 | |
| 4 | 37 | 2 | 23 | -17.58 | 277.75 | -29.57 | 130.41 | 0.6200 | 61.6 | 85.5 | |
| 4 | -5 | 2 | -5 | -16.89 | 277.78 | -29.54 | 129.55 | 0.6141 | 465.7 | 999999 | |
| 0 | 32 | 0 | 20 | -15.82 | 276.13 | -31.19 | 126.63 | 0.6232 | -944.0 | -763.6 | |
| 0 | 4 | 0 | 3 | -16.47 | 275.87 | -31.45 | 127.27 | 0.6310 | 243.0 | 183.2 | |
| 0 | 3 | 0 | 2 | -15.93 | 275.63 | -31.69 | 126.36 | 0.6295 | -386.0 | -479.3 | |
| 18 | 1599 | 12 | 1061 | -18.18 | 275.00 | -32.32 | 128.73 | 0.6534 | -1862.3 | -223.3 | |
| 108 | -10 | 71 | -10 | -19.10 | 274.76 | -32.56 | 129.66 | 0.6629 | -1271.0 | 999999 | |
| 5 | -10 | 4 | -10 | -16.15 | 274.87 | -32.45 | 126.01 | 0.6394 | -359.6 | 999999 | |
| 34 | -10 | 23 | -10 | -18.79 | 273.69 | -33.63 | 128.40 | 0.6713 | -1090.2 | 999999 | |
| 8 | -10 | 5 | -10 | -16.79 | 273.63 | -33.69 | 125.84 | 0.6574 | 997.4 | 999999 | |
| 12 | -10 | 8 | -10 | -17.31 | 273.42 | -33.90 | 126.34 | 0.6633 | 155.5 | 999999 | |
| 9 | -10 | 6 | -10 | -19.03 | 272.84 | -34.48 | 128.01 | 0.6816 | -379.6 | 999999 | |
| 9 | -10 | 6 | -10 | -18.11 | 273.00 | -34.32 | 127.01 | 0.6734 | -108.4 | 999999 | |
| 7 | -10 | 5 | -10 | -16.65 | 273.22 | -34.10 | 125.33 | 0.6608 | 1417.3 | 999999 | |
| 12 | -10 | 8 | -10 | -16.98 | 272.75 | -34.57 | 125.39 | 0.6680 | 986.3 | 999999 | |
| 11 | -10 | 7 | -10 | -18.95 | 272.05 | -35.27 | 127.31 | 0.6890 | 840.6 | 999999 | |
| 12 | -10 | 8 | -10 | -17.95 | 272.24 | -35.08 | 126.23 | 0.6801 | 1071.3 | 999999 | |
| 7 | -10 | 5 | -10 | -20.43 | 271.42 | -35.90 | 128.60 | 0.7055 | 733.7 | 999999 | |
| 0 | 10 | 0 | 7 | -20.87 | 270.77 | -36.54 | 128.65 | 0.7147 | 793.0 | 745.3 | |
| 0 | 2 | 0 | 2 | -19.73 | 270.42 | -36.90 | 127.04 | 0.7104 | 444.0 | 431.9 | |
| 0 | 5 | 0 | 4 | -19.07 | 269.97 | -37.35 | 125.93 | 0.7105 | 422.0 | 302.0 | |
| 0 | 4 | 0 | 3 | -22.08 | 268.87 | -38.45 | 128.68 | 0.7404 | 643.0 | 569.0 | |
| 0 | 6 | 0 | 4 | -17.39 | 270.14 | -37.18 | 124.00 | 0.6980 | 548.0 | 588.2 | |
| 0 | 5 | 0 | 4 | -18.31 | 269.86 | -37.46 | 124.93 | 0.7067 | 338.0 | 329.4 | |
| 0 | 5 | 0 | 4 | -20.63 | 268.31 | -39.01 | 126.64 | 0.7365 | 494.0 | 516.3 | |
| Proj. U | - Projected umbra area in millionths of solar disc, negative values indicate | |
|
that the umbra consists of fragmented regions which cannot be separated without losing umbral area. In this way several spots (intensity minima in the umbra) have a common umbra, e.g. -2 means that the given spot shares an umbra with spot No.2, and the common U value is indicated at spot No.2. |
||
| Proj. WS | - Projected whole spot area in millionths of solar disc, negative values indicate | |
|
that several umbras have a common penumbra, e.g. -7 means that the given umbra shares a penumbra with umbra No.7, and the WS value is indicated at No.7. |
||
| Corr. U | - Corrected umbra area in millionths of solar hemisphere, for negative values see above | |
| Corr. WS | - Corrected whole spot area in millionths of solar hemisphere, for negative values see above | |
| B | - Heliographic latitude B; positive: North, negative: South | |
| L | - Heliographic longitude L | |
| LCM | - Longitudinal distance from the Sun's central meridian | |
| Pos. angle | - Position angle | |
| r | - Distance from the centre of Sun's disc in terms of Sun's radius | |
| MU | - Mean magnetic field within the umbra contour averaged the pixel values with sign. | |
| MP | - Mean magnetic field within the penumbra contour averaged the pixel values with sign. | |