SOHO MDI 2001-09-23 22:23:33 UT
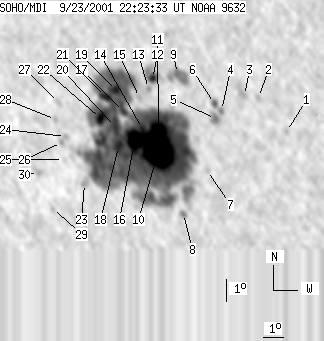
| group | Proj. U | Proj. WS | Corr. U | Corr. WS | B | L | LCM | Pos. angle | r | MU | MP |
| 227 | 1676 | 146 | 1085 | -18.59 | 274.21 | -31.35 | 130.08 | 0.6466 | -834.3 | -191.7 | |
|
previous
or next observation for the same group /
back to the solar disc SOHO MDI 2001-09-23 22:23:33 UT |
| spot | Proj. U | Proj. WS | Corr. U | Corr. WS | B | L | LCM | Pos. angle | r | MU | MP |
| 0 | 6 | 0 | 3 | -17.97 | 280.94 | -24.61 | 136.07 | 0.5732 | 484.0 | 389.1 | |
| 0 | 5 | 0 | 3 | -16.58 | 279.89 | -25.67 | 133.06 | 0.5706 | 823.0 | 716.1 | |
| 0 | 8 | 0 | 5 | -16.53 | 279.26 | -26.30 | 132.32 | 0.5767 | 710.0 | 600.5 | |
| 0 | 5 | 0 | 3 | -17.23 | 278.10 | -27.46 | 132.03 | 0.5952 | 632.0 | 460.0 | |
| 0 | 13 | 0 | 8 | -17.59 | 277.76 | -27.80 | 132.15 | 0.6019 | -134.0 | -11.1 | |
| 2 | 8 | 1 | 5 | -16.95 | 277.82 | -27.74 | 131.38 | 0.5956 | 586.9 | 503.3 | |
| 0 | 4 | 0 | 3 | -19.88 | 276.97 | -28.59 | 134.21 | 0.6302 | -797.0 | -675.2 | |
| 0 | 6 | 0 | 4 | -21.87 | 275.39 | -30.17 | 135.04 | 0.6625 | 207.0 | 220.7 | |
| 0 | 35 | 0 | 22 | -15.78 | 276.30 | -29.26 | 128.32 | 0.6018 | -764.0 | -724.6 | |
| 110 | 1509 | 71 | 979 | -19.16 | 274.78 | -30.78 | 131.27 | 0.6455 | -1276.4 | -215.3 | |
| 17 | -10 | 11 | -10 | -18.15 | 274.98 | -30.58 | 130.21 | 0.6352 | -2000.0 | 999999 | |
| 5 | 30 | 3 | 19 | -16.06 | 275.08 | -30.48 | 127.59 | 0.6174 | -302.8 | -95.6 | |
| 0 | 5 | 0 | 3 | -16.50 | 274.81 | -30.75 | 127.93 | 0.6237 | -403.0 | -296.9 | |
| 5 | -10 | 3 | -10 | -18.25 | 274.20 | -31.36 | 129.63 | 0.6440 | -1263.4 | 999999 | |
| 0 | 4 | 0 | 3 | -16.92 | 274.31 | -31.25 | 128.03 | 0.6324 | -268.0 | -230.1 | |
| 34 | -10 | 22 | -10 | -18.84 | 273.69 | -31.87 | 129.92 | 0.6539 | -1122.8 | 999999 | |
| 3 | -10 | 2 | -10 | -17.58 | 273.41 | -32.14 | 128.10 | 0.6469 | -537.0 | 999999 | |
| 11 | -10 | 7 | -10 | -19.12 | 272.84 | -32.72 | 129.54 | 0.6645 | -522.7 | 999999 | |
| 7 | -10 | 5 | -10 | -16.69 | 273.25 | -32.31 | 126.83 | 0.6419 | 1419.6 | 999999 | |
| 16 | -10 | 10 | -10 | -18.25 | 272.89 | -32.67 | 128.51 | 0.6575 | 153.8 | 999999 | |
| 8 | -10 | 5 | -10 | -16.99 | 272.66 | -32.90 | 126.72 | 0.6504 | 992.9 | 999999 | |
| 9 | -10 | 6 | -10 | -17.96 | 272.21 | -33.35 | 127.59 | 0.6622 | 1124.3 | 999999 | |
| 0 | 5 | 0 | 3 | -20.88 | 270.71 | -34.85 | 129.93 | 0.6985 | 699.0 | 658.1 | |
| 0 | 4 | 0 | 3 | -18.87 | 270.26 | -35.30 | 127.18 | 0.6887 | 714.0 | 717.6 | |
| 0 | 1 | 0 | 0 | -19.89 | 269.90 | -35.66 | 128.14 | 0.6993 | 335.0 | 346.7 | |
| 0 | 4 | 0 | 3 | -19.15 | 269.99 | -35.57 | 127.32 | 0.6933 | 411.0 | 384.3 | |
| 0 | 6 | 0 | 4 | -17.42 | 270.25 | -35.31 | 125.38 | 0.6788 | 756.0 | 548.2 | |
| 0 | 5 | 0 | 3 | -18.17 | 269.92 | -35.64 | 126.07 | 0.6872 | 519.0 | 316.5 | |
| 0 | 5 | 0 | 3 | -22.13 | 268.69 | -36.86 | 129.85 | 0.7262 | 562.0 | 451.7 | |
| 0 | 8 | 0 | 6 | -20.57 | 268.42 | -37.14 | 127.86 | 0.7183 | 559.0 | 515.9 | |
| Proj. U | - Projected umbra area in millionths of solar disc, negative values indicate | |
|
that the umbra consists of fragmented regions which cannot be separated without losing umbral area. In this way several spots (intensity minima in the umbra) have a common umbra, e.g. -2 means that the given spot shares an umbra with spot No.2, and the common U value is indicated at spot No.2. |
||
| Proj. WS | - Projected whole spot area in millionths of solar disc, negative values indicate | |
|
that several umbras have a common penumbra, e.g. -7 means that the given umbra shares a penumbra with umbra No.7, and the WS value is indicated at No.7. |
||
| Corr. U | - Corrected umbra area in millionths of solar hemisphere, for negative values see above | |
| Corr. WS | - Corrected whole spot area in millionths of solar hemisphere, for negative values see above | |
| B | - Heliographic latitude B; positive: North, negative: South | |
| L | - Heliographic longitude L | |
| LCM | - Longitudinal distance from the Sun's central meridian | |
| Pos. angle | - Position angle | |
| r | - Distance from the centre of Sun's disc in terms of Sun's radius | |
| MU | - Mean magnetic field within the umbra contour averaged the pixel values with sign. | |
| MP | - Mean magnetic field within the penumbra contour averaged the pixel values with sign. | |