SOHO MDI 2001-09-23 23:59:33 UT
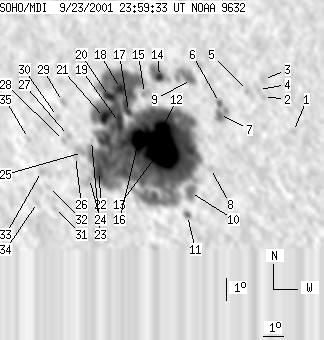
| group | Proj. U | Proj. WS | Corr. U | Corr. WS | B | L | LCM | Pos. angle | r | MU | MP |
| 230 | 1714 | 148 | 1101 | -18.72 | 274.07 | -30.61 | 130.91 | 0.6401 | -750.2 | -200.1 | |
|
previous
or next observation for the same group /
back to the solar disc SOHO MDI 2001-09-23 23:59:33 UT |
| spot | Proj. U | Proj. WS | Corr. U | Corr. WS | B | L | LCM | Pos. angle | r | MU | MP |
| 0 | 5 | 0 | 3 | -18.01 | 281.00 | -23.67 | 137.21 | 0.5643 | 561.0 | 449.3 | |
| 0 | 4 | 0 | 2 | -16.58 | 279.86 | -24.82 | 134.02 | 0.5616 | 823.0 | 763.8 | |
| 0 | 5 | 0 | 3 | -15.85 | 279.96 | -24.72 | 133.15 | 0.5536 | 155.0 | 300.7 | |
| 0 | 4 | 0 | 2 | -16.29 | 279.68 | -25.00 | 133.43 | 0.5608 | 624.0 | 480.3 | |
| 0 | 4 | 0 | 2 | -16.36 | 279.17 | -25.51 | 132.95 | 0.5667 | 543.0 | 514.3 | |
| 0 | 6 | 0 | 3 | -16.94 | 277.82 | -26.86 | 132.27 | 0.5863 | 709.0 | 520.2 | |
| 0 | 24 | 0 | 15 | -17.46 | 277.73 | -26.95 | 132.85 | 0.5919 | 181.0 | 166.8 | |
| 0 | 5 | 0 | 3 | -19.84 | 276.90 | -27.78 | 134.96 | 0.6219 | -865.0 | -689.9 | |
| 0 | 34 | 0 | 21 | -16.04 | 276.67 | -28.01 | 129.89 | 0.5904 | -1161.0 | -701.1 | |
| 0 | 21 | 0 | 13 | -20.96 | 275.73 | -28.95 | 135.13 | 0.6431 | -944.0 | -714.3 | |
| 1 | 7 | 1 | 5 | -21.99 | 275.35 | -29.33 | 135.97 | 0.6558 | 252.0 | 220.5 | |
| 17 | 1488 | 11 | 959 | -18.19 | 274.95 | -29.73 | 131.03 | 0.6268 | -1944.5 | -231.1 | |
| 114 | -12 | 73 | -12 | -19.10 | 274.73 | -29.95 | 131.96 | 0.6368 | -1290.3 | 999999 | |
| 6 | 37 | 4 | 23 | -16.00 | 275.20 | -29.48 | 128.42 | 0.6061 | -228.5 | -206.7 | |
| 0 | 6 | 0 | 4 | -16.77 | 274.36 | -30.32 | 128.67 | 0.6213 | -381.0 | -308.1 | |
| 35 | -12 | 23 | -12 | -18.83 | 273.68 | -31.00 | 130.67 | 0.6450 | -1146.3 | 999999 | |
| 3 | -12 | 2 | -12 | -17.60 | 273.45 | -31.23 | 128.92 | 0.6375 | -530.3 | 999999 | |
| 7 | -12 | 4 | -12 | -16.64 | 273.25 | -31.43 | 127.50 | 0.6321 | 1427.3 | 999999 | |
| 13 | -12 | 9 | -12 | -18.11 | 272.91 | -31.77 | 129.09 | 0.6470 | 210.3 | 999999 | |
| 8 | -12 | 5 | -12 | -17.02 | 272.65 | -32.03 | 127.48 | 0.6414 | 953.7 | 999999 | |
| 10 | -12 | 6 | -12 | -17.94 | 272.22 | -32.46 | 128.29 | 0.6529 | 1184.3 | 999999 | |
| 16 | -12 | 10 | -12 | -20.32 | 271.44 | -33.24 | 130.56 | 0.6790 | 814.2 | 999999 | |
| 0 | 2 | 0 | 1 | -18.99 | 271.35 | -33.33 | 128.88 | 0.6696 | 426.0 | 447.7 | |
| 0 | 11 | 0 | 8 | -20.67 | 270.85 | -33.83 | 130.49 | 0.6873 | 660.0 | 579.5 | |
| 0 | 10 | 0 | 7 | -19.55 | 270.78 | -33.90 | 129.09 | 0.6796 | 648.0 | 659.2 | |
| 0 | 5 | 0 | 3 | -19.75 | 270.38 | -34.30 | 129.01 | 0.6850 | 500.0 | 432.7 | |
| 0 | 3 | 0 | 2 | -18.85 | 270.24 | -34.44 | 127.82 | 0.6798 | 849.0 | 743.7 | |
| 0 | 5 | 0 | 3 | -19.09 | 269.93 | -34.75 | 127.87 | 0.6846 | 309.0 | 363.2 | |
| 0 | 5 | 0 | 3 | -17.39 | 270.27 | -34.41 | 126.04 | 0.6692 | 721.0 | 627.0 | |
| 0 | 4 | 0 | 3 | -18.06 | 269.87 | -34.81 | 126.57 | 0.6780 | 314.0 | 390.7 | |
| 0 | 4 | 0 | 3 | -22.15 | 268.65 | -36.03 | 130.49 | 0.7187 | 572.0 | 513.3 | |
| 0 | 3 | 0 | 2 | -21.19 | 268.62 | -36.06 | 129.36 | 0.7122 | 471.0 | 427.4 | |
| 0 | 4 | 0 | 2 | -20.55 | 268.44 | -36.24 | 128.48 | 0.7095 | 578.0 | 524.5 | |
| 0 | 4 | 0 | 3 | -21.95 | 267.82 | -36.86 | 129.65 | 0.7250 | 337.0 | 354.0 | |
| 0 | 4 | 0 | 3 | -19.14 | 268.14 | -36.54 | 126.59 | 0.7028 | 499.0 | 437.4 | |
| Proj. U | - Projected umbra area in millionths of solar disc, negative values indicate | |
|
that the umbra consists of fragmented regions which cannot be separated without losing umbral area. In this way several spots (intensity minima in the umbra) have a common umbra, e.g. -2 means that the given spot shares an umbra with spot No.2, and the common U value is indicated at spot No.2. |
||
| Proj. WS | - Projected whole spot area in millionths of solar disc, negative values indicate | |
|
that several umbras have a common penumbra, e.g. -7 means that the given umbra shares a penumbra with umbra No.7, and the WS value is indicated at No.7. |
||
| Corr. U | - Corrected umbra area in millionths of solar hemisphere, for negative values see above | |
| Corr. WS | - Corrected whole spot area in millionths of solar hemisphere, for negative values see above | |
| B | - Heliographic latitude B; positive: North, negative: South | |
| L | - Heliographic longitude L | |
| LCM | - Longitudinal distance from the Sun's central meridian | |
| Pos. angle | - Position angle | |
| r | - Distance from the centre of Sun's disc in terms of Sun's radius | |
| MU | - Mean magnetic field within the umbra contour averaged the pixel values with sign. | |
| MP | - Mean magnetic field within the penumbra contour averaged the pixel values with sign. | |