SOHO MDI 2001-09-24 06:11:33 UT
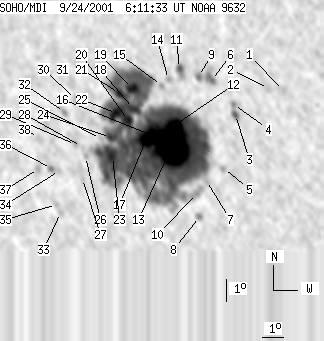
| group | Proj. U | Proj. WS | Corr. U | Corr. WS | B | L | LCM | Pos. angle | r | MU | MP |
| 227 | 1723 | 141 | 1071 | -18.65 | 273.87 | -27.40 | 133.91 | 0.6074 | -725.3 | -217.6 | |
|
previous
or next observation for the same group /
back to the solar disc SOHO MDI 2001-09-24 06:11:33 UT |
| spot | Proj. U | Proj. WS | Corr. U | Corr. WS | B | L | LCM | Pos. angle | r | MU | MP |
| 0 | 6 | 0 | 4 | -16.44 | 280.05 | -21.22 | 138.29 | 0.5237 | 695.0 | 649.4 | |
| 0 | 5 | 0 | 3 | -16.39 | 279.41 | -21.87 | 137.36 | 0.5296 | 559.0 | 535.6 | |
| 3 | 6 | 2 | 4 | -17.58 | 277.79 | -23.48 | 136.89 | 0.5579 | -241.1 | -153.1 | |
| 0 | 7 | 0 | 4 | -17.15 | 277.76 | -23.51 | 136.31 | 0.5539 | 621.0 | 371.6 | |
| 0 | 4 | 0 | 3 | -19.95 | 276.89 | -24.38 | 138.76 | 0.5908 | -827.0 | -656.2 | |
| 0 | 15 | 0 | 9 | -16.18 | 276.91 | -24.36 | 134.01 | 0.5529 | -884.0 | -879.7 | |
| 0 | 4 | 0 | 2 | -20.53 | 276.02 | -25.26 | 138.44 | 0.6046 | -560.0 | -482.1 | |
| 0 | 6 | 0 | 4 | -22.15 | 275.39 | -25.89 | 139.61 | 0.6263 | 504.0 | 466.0 | |
| 0 | 9 | 0 | 5 | -16.04 | 276.35 | -24.92 | 133.17 | 0.5574 | -698.0 | -612.2 | |
| 0 | 18 | 0 | 11 | -21.13 | 275.44 | -25.83 | 138.51 | 0.6157 | -591.0 | -462.9 | |
| 4 | 19 | 2 | 11 | -15.75 | 275.54 | -25.73 | 131.86 | 0.5633 | -780.0 | -354.7 | |
| 15 | 1530 | 9 | 952 | -18.16 | 275.00 | -26.27 | 134.45 | 0.5914 | -2254.6 | -254.9 | |
| 111 | -12 | 69 | -12 | -19.12 | 274.65 | -26.62 | 135.28 | 0.6040 | -1358.4 | 999999 | |
| 0 | 5 | 0 | 3 | -16.24 | 274.97 | -26.30 | 131.92 | 0.5739 | -499.0 | -449.6 | |
| 0 | 5 | 0 | 3 | -16.52 | 274.61 | -26.66 | 131.91 | 0.5802 | -485.0 | -335.9 | |
| 15 | -12 | 10 | -12 | -18.73 | 273.93 | -27.34 | 134.05 | 0.6074 | -1468.4 | 999999 | |
| 15 | -12 | 9 | -12 | -18.93 | 273.48 | -27.80 | 133.84 | 0.6138 | -1123.6 | 999999 | |
| 8 | -12 | 5 | -12 | -17.58 | 273.16 | -28.11 | 131.80 | 0.6049 | -224.3 | 999999 | |
| 11 | -12 | 7 | -12 | -16.72 | 273.25 | -28.02 | 130.78 | 0.5964 | 1501.7 | 999999 | |
| 8 | -12 | 5 | -12 | -18.11 | 272.83 | -28.44 | 132.16 | 0.6129 | 217.8 | 999999 | |
| 5 | -12 | 3 | -12 | -16.97 | 272.61 | -28.66 | 130.48 | 0.6054 | 1049.3 | 999999 | |
| 17 | -12 | 11 | -12 | -17.85 | 272.32 | -28.95 | 131.32 | 0.6159 | 1253.4 | 999999 | |
| 11 | -12 | 7 | -12 | -19.73 | 271.77 | -29.50 | 133.14 | 0.6376 | 634.4 | 999999 | |
| 4 | -12 | 2 | -12 | -18.91 | 271.84 | -29.43 | 132.19 | 0.6298 | 949.5 | 999999 | |
| 0 | 4 | 0 | 2 | -18.98 | 271.35 | -29.92 | 131.83 | 0.6354 | 397.0 | 507.8 | |
| 0 | 4 | 0 | 3 | -19.82 | 270.45 | -30.82 | 132.03 | 0.6512 | 499.0 | 561.6 | |
| 0 | 3 | 0 | 2 | -20.80 | 270.09 | -31.18 | 132.88 | 0.6628 | 569.0 | 515.0 | |
| 0 | 1 | 0 | 0 | -19.39 | 270.35 | -30.92 | 131.42 | 0.6487 | 584.0 | 584.0 | |
| 0 | 7 | 0 | 4 | -19.32 | 270.08 | -31.19 | 131.09 | 0.6509 | 656.0 | 505.1 | |
| 0 | 7 | 0 | 4 | -17.37 | 270.47 | -30.80 | 128.99 | 0.6311 | 846.0 | 705.1 | |
| 0 | 14 | 0 | 9 | -16.56 | 270.47 | -30.80 | 127.95 | 0.6246 | 856.0 | 660.1 | |
| 0 | 8 | 0 | 5 | -17.96 | 269.83 | -31.44 | 129.18 | 0.6425 | 347.0 | 497.5 | |
| 0 | 5 | 0 | 3 | -22.40 | 268.60 | -32.67 | 133.44 | 0.6897 | 562.0 | 432.4 | |
| 0 | 3 | 0 | 2 | -20.52 | 269.02 | -32.25 | 131.62 | 0.6708 | 417.0 | 500.2 | |
| 0 | 4 | 0 | 3 | -22.06 | 268.49 | -32.78 | 132.96 | 0.6879 | 705.0 | 611.9 | |
| 0 | 6 | 0 | 4 | -20.46 | 268.64 | -32.63 | 131.23 | 0.6740 | 729.0 | 568.3 | |
| 0 | 7 | 0 | 5 | -20.51 | 267.99 | -33.28 | 130.74 | 0.6807 | 604.0 | 464.9 | |
| 0 | 11 | 0 | 7 | -19.14 | 268.31 | -32.96 | 129.36 | 0.6671 | 471.0 | 273.7 | |
| Proj. U | - Projected umbra area in millionths of solar disc, negative values indicate | |
|
that the umbra consists of fragmented regions which cannot be separated without losing umbral area. In this way several spots (intensity minima in the umbra) have a common umbra, e.g. -2 means that the given spot shares an umbra with spot No.2, and the common U value is indicated at spot No.2. |
||
| Proj. WS | - Projected whole spot area in millionths of solar disc, negative values indicate | |
|
that several umbras have a common penumbra, e.g. -7 means that the given umbra shares a penumbra with umbra No.7, and the WS value is indicated at No.7. |
||
| Corr. U | - Corrected umbra area in millionths of solar hemisphere, for negative values see above | |
| Corr. WS | - Corrected whole spot area in millionths of solar hemisphere, for negative values see above | |
| B | - Heliographic latitude B; positive: North, negative: South | |
| L | - Heliographic longitude L | |
| LCM | - Longitudinal distance from the Sun's central meridian | |
| Pos. angle | - Position angle | |
| r | - Distance from the centre of Sun's disc in terms of Sun's radius | |
| MU | - Mean magnetic field within the umbra contour averaged the pixel values with sign. | |
| MP | - Mean magnetic field within the penumbra contour averaged the pixel values with sign. | |