SOHO MDI 2001-09-24 09:35:33 UT
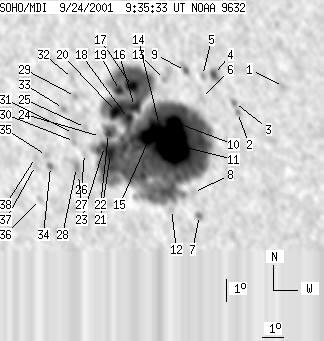
| group | Proj. U | Proj. WS | Corr. U | Corr. WS | B | L | LCM | Pos. angle | r | MU | MP |
| 241 | 1790 | 147 | 1095 | -18.65 | 273.87 | -25.53 | 135.91 | 0.5889 | -795.3 | -200.4 | |
|
previous
or next observation for the same group /
back to the solar disc SOHO MDI 2001-09-24 09:35:33 UT |
| spot | Proj. U | Proj. WS | Corr. U | Corr. WS | B | L | LCM | Pos. angle | r | MU | MP |
| 0 | 10 | 0 | 6 | -16.41 | 279.97 | -19.43 | 140.70 | 0.5060 | 773.0 | 619.0 | |
| 0 | 5 | 0 | 3 | -17.61 | 277.83 | -21.57 | 139.31 | 0.5397 | -157.0 | -127.6 | |
| 0 | 6 | 0 | 4 | -17.19 | 277.75 | -21.65 | 138.67 | 0.5359 | 476.0 | 329.0 | |
| 4 | 13 | 2 | 8 | -16.04 | 276.97 | -22.44 | 136.15 | 0.5316 | -1017.9 | -850.5 | |
| 0 | 6 | 0 | 3 | -16.10 | 276.47 | -22.93 | 135.62 | 0.5373 | -537.0 | -561.6 | |
| 0 | 9 | 0 | 5 | -17.04 | 276.31 | -23.09 | 136.67 | 0.5486 | -596.0 | -517.3 | |
| 0 | 6 | 0 | 4 | -22.22 | 275.41 | -23.99 | 141.77 | 0.6106 | 450.0 | 441.6 | |
| 0 | 6 | 0 | 4 | -21.21 | 275.32 | -24.09 | 140.54 | 0.6009 | -539.0 | -434.5 | |
| 0 | 11 | 0 | 6 | -15.93 | 275.75 | -23.66 | 134.49 | 0.5431 | -777.0 | -520.5 | |
| 19 | 1608 | 12 | 983 | -18.18 | 274.99 | -24.41 | 136.55 | 0.5732 | -2281.0 | -239.9 | |
| 114 | -10 | 69 | -10 | -19.14 | 274.75 | -24.65 | 137.46 | 0.5851 | -1460.9 | 999999 | |
| 0 | 5 | 0 | 3 | -22.02 | 274.15 | -25.25 | 140.15 | 0.6194 | -457.0 | -401.1 | |
| 0 | 17 | 0 | 10 | -16.36 | 274.75 | -24.65 | 133.91 | 0.5576 | -595.0 | -410.9 | |
| 4 | -10 | 2 | -10 | -18.35 | 274.24 | -25.16 | 135.91 | 0.5822 | -1473.7 | 999999 | |
| 29 | -10 | 18 | -10 | -18.81 | 273.75 | -25.65 | 135.94 | 0.5914 | -1422.4 | 999999 | |
| 13 | -10 | 8 | -10 | -17.59 | 273.22 | -26.18 | 133.82 | 0.5852 | -370.3 | 999999 | |
| 13 | -10 | 8 | -10 | -16.74 | 273.26 | -26.14 | 132.75 | 0.5768 | 1528.4 | 999999 | |
| 5 | -10 | 3 | -10 | -18.13 | 272.86 | -26.54 | 134.12 | 0.5938 | -99.5 | 999999 | |
| 6 | -10 | 3 | -10 | -16.95 | 272.64 | -26.77 | 132.36 | 0.5852 | 1052.8 | 999999 | |
| 14 | -10 | 9 | -10 | -17.86 | 272.35 | -27.05 | 133.24 | 0.5964 | 1378.8 | 999999 | |
| 11 | -10 | 7 | -10 | -19.70 | 271.75 | -27.66 | 134.91 | 0.6193 | 776.8 | 999999 | |
| 5 | -10 | 3 | -10 | -18.83 | 271.81 | -27.59 | 133.92 | 0.6108 | 905.1 | 999999 | |
| 4 | -10 | 3 | -10 | -19.41 | 271.52 | -27.88 | 134.33 | 0.6189 | 1256.1 | 999999 | |
| 0 | 2 | 0 | 1 | -18.99 | 271.41 | -27.99 | 133.70 | 0.6161 | 387.0 | 508.7 | |
| 0 | 4 | 0 | 3 | -18.64 | 270.77 | -28.63 | 132.64 | 0.6194 | -66.0 | -37.7 | |
| 0 | 5 | 0 | 3 | -19.78 | 270.51 | -28.89 | 133.78 | 0.6320 | 580.0 | 521.9 | |
| 0 | 7 | 0 | 5 | -20.73 | 270.03 | -29.38 | 134.45 | 0.6450 | 534.0 | 548.4 | |
| 0 | 13 | 0 | 9 | -20.42 | 270.00 | -29.41 | 134.06 | 0.6426 | 825.0 | 781.4 | |
| 0 | 5 | 0 | 3 | -17.33 | 270.54 | -28.86 | 130.74 | 0.6104 | 761.0 | 601.0 | |
| 0 | 5 | 0 | 3 | -19.28 | 270.13 | -29.27 | 132.81 | 0.6314 | 741.0 | 586.9 | |
| 0 | 4 | 0 | 2 | -18.94 | 270.15 | -29.25 | 132.40 | 0.6282 | 692.0 | 716.7 | |
| 0 | 9 | 0 | 6 | -16.56 | 270.53 | -28.87 | 129.73 | 0.6040 | 829.0 | 616.3 | |
| 0 | 6 | 0 | 4 | -17.88 | 269.88 | -29.52 | 130.82 | 0.6220 | 621.0 | 478.0 | |
| 0 | 7 | 0 | 4 | -20.46 | 268.74 | -30.67 | 132.93 | 0.6550 | 851.0 | 639.8 | |
| 0 | 5 | 0 | 3 | -19.99 | 268.65 | -30.76 | 132.29 | 0.6519 | 699.0 | 683.0 | |
| 0 | 6 | 0 | 4 | -21.97 | 267.84 | -31.56 | 133.90 | 0.6759 | 567.0 | 465.3 | |
| 0 | 6 | 0 | 4 | -20.46 | 268.01 | -31.40 | 132.29 | 0.6621 | 555.0 | 419.1 | |
| 0 | 4 | 0 | 2 | -20.11 | 268.09 | -31.32 | 131.93 | 0.6584 | 448.0 | 390.6 | |
| Proj. U | - Projected umbra area in millionths of solar disc, negative values indicate | |
|
that the umbra consists of fragmented regions which cannot be separated without losing umbral area. In this way several spots (intensity minima in the umbra) have a common umbra, e.g. -2 means that the given spot shares an umbra with spot No.2, and the common U value is indicated at spot No.2. |
||
| Proj. WS | - Projected whole spot area in millionths of solar disc, negative values indicate | |
|
that several umbras have a common penumbra, e.g. -7 means that the given umbra shares a penumbra with umbra No.7, and the WS value is indicated at No.7. |
||
| Corr. U | - Corrected umbra area in millionths of solar hemisphere, for negative values see above | |
| Corr. WS | - Corrected whole spot area in millionths of solar hemisphere, for negative values see above | |
| B | - Heliographic latitude B; positive: North, negative: South | |
| L | - Heliographic longitude L | |
| LCM | - Longitudinal distance from the Sun's central meridian | |
| Pos. angle | - Position angle | |
| r | - Distance from the centre of Sun's disc in terms of Sun's radius | |
| MU | - Mean magnetic field within the umbra contour averaged the pixel values with sign. | |
| MP | - Mean magnetic field within the penumbra contour averaged the pixel values with sign. | |