SOHO MDI 2001-09-24 11:11:33 UT
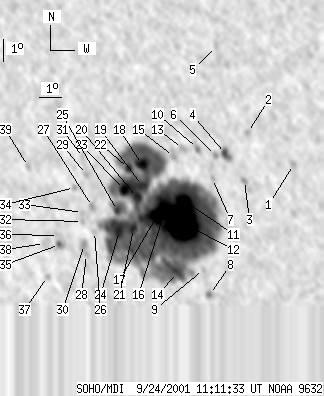
| group | Proj. U | Proj. WS | Corr. U | Corr. WS | B | L | LCM | Pos. angle | r | MU | MP |
| 249 | 1808 | 154 | 1100 | -18.83 | 273.83 | -24.69 | 137.05 | 0.5824 | -770.4 | -144.3 | |
|
previous
or next observation for the same group /
back to the solar disc SOHO MDI 2001-09-24 11:11:33 UT |
| spot | Proj. U | Proj. WS | Corr. U | Corr. WS | B | L | LCM | Pos. angle | r | MU | MP |
| 0 | 7 | 0 | 4 | -16.42 | 279.95 | -18.58 | 141.96 | 0.4980 | 836.0 | 677.0 | |
| 0 | 5 | 0 | 3 | -15.14 | 278.10 | -20.43 | 137.60 | 0.5016 | 645.0 | 488.9 | |
| 0 | 5 | 0 | 3 | -17.19 | 277.74 | -20.78 | 139.83 | 0.5276 | 299.0 | 277.2 | |
| 4 | 17 | 3 | 10 | -16.08 | 277.04 | -21.48 | 137.44 | 0.5223 | -911.9 | -733.9 | |
| 0 | 6 | 0 | 3 | -11.62 | 277.09 | -21.43 | 130.93 | 0.4757 | 464.0 | 400.0 | |
| 0 | 5 | 0 | 3 | -16.18 | 276.59 | -21.93 | 136.99 | 0.5279 | -693.0 | -543.3 | |
| 0 | 5 | 0 | 3 | -17.17 | 276.34 | -22.18 | 137.97 | 0.5409 | -661.0 | -552.6 | |
| 0 | 7 | 0 | 5 | -22.26 | 275.44 | -23.08 | 142.87 | 0.6033 | 611.0 | 452.9 | |
| 0 | 4 | 0 | 2 | -21.16 | 275.36 | -23.17 | 141.56 | 0.5923 | -437.0 | -371.7 | |
| 0 | 5 | 0 | 3 | -15.92 | 275.84 | -22.69 | 135.68 | 0.5330 | -625.0 | -522.2 | |
| 15 | 1636 | 9 | 995 | -18.18 | 274.92 | -23.61 | 137.50 | 0.5653 | -2241.9 | -183.4 | |
| 115 | -11 | 70 | -11 | -19.19 | 274.72 | -23.80 | 138.50 | 0.5775 | -1454.9 | 999999 | |
| 0 | 9 | 0 | 5 | -15.96 | 275.17 | -23.35 | 134.90 | 0.5402 | -656.0 | -498.8 | |
| 12 | -11 | 8 | -11 | -21.36 | 274.13 | -24.39 | 140.36 | 0.6051 | -594.0 | 999999 | |
| 0 | 12 | 0 | 7 | -16.32 | 274.73 | -23.80 | 134.85 | 0.5484 | -348.0 | -163.8 | |
| 15 | -11 | 9 | -11 | -18.71 | 273.98 | -24.54 | 137.06 | 0.5797 | -1621.4 | 999999 | |
| 14 | -11 | 8 | -11 | -18.94 | 273.58 | -24.94 | 136.89 | 0.5859 | -1208.5 | 999999 | |
| 10 | -11 | 6 | -11 | -16.73 | 273.28 | -25.24 | 133.73 | 0.5673 | 1629.9 | 999999 | |
| 12 | -11 | 7 | -11 | -17.64 | 273.15 | -25.37 | 134.76 | 0.5774 | -113.8 | 999999 | |
| 11 | -11 | 7 | -11 | -18.17 | 272.84 | -25.68 | 135.10 | 0.5856 | -7.2 | 999999 | |
| 7 | -11 | 5 | -11 | -19.53 | 272.43 | -26.09 | 136.33 | 0.6026 | -623.1 | 999999 | |
| 6 | -11 | 4 | -11 | -16.94 | 272.62 | -25.90 | 133.27 | 0.5762 | 1111.2 | 999999 | |
| 9 | -11 | 6 | -11 | -17.85 | 272.30 | -26.23 | 134.11 | 0.5880 | 1588.4 | 999999 | |
| 14 | -11 | 9 | -11 | -19.65 | 271.76 | -26.76 | 135.77 | 0.6102 | 812.8 | 999999 | |
| 3 | -11 | 2 | -11 | -18.78 | 271.82 | -26.70 | 134.77 | 0.6015 | 1037.6 | 999999 | |
| 0 | 4 | 0 | 3 | -19.77 | 270.57 | -27.95 | 134.69 | 0.6227 | 785.0 | 619.4 | |
| 0 | 5 | 0 | 3 | -18.68 | 270.68 | -27.84 | 133.46 | 0.6118 | 98.0 | 194.1 | |
| 0 | 5 | 0 | 3 | -20.81 | 269.99 | -28.54 | 135.35 | 0.6377 | 694.0 | 587.6 | |
| 0 | 6 | 0 | 4 | -17.31 | 270.64 | -27.88 | 131.68 | 0.6001 | 823.0 | 658.7 | |
| 0 | 9 | 0 | 6 | -20.37 | 269.98 | -28.54 | 134.83 | 0.6338 | 928.0 | 850.6 | |
| 0 | 8 | 0 | 5 | -16.59 | 270.62 | -27.90 | 130.71 | 0.5940 | 644.0 | 535.9 | |
| 0 | 4 | 0 | 2 | -19.36 | 270.09 | -28.44 | 133.72 | 0.6239 | 651.0 | 550.0 | |
| 0 | 3 | 0 | 2 | -18.97 | 270.16 | -28.36 | 133.31 | 0.6196 | 934.0 | 813.3 | |
| 0 | 4 | 0 | 3 | -17.91 | 269.98 | -28.54 | 131.79 | 0.6121 | 629.0 | 583.9 | |
| 2 | 10 | 1 | 6 | -20.45 | 268.77 | -29.75 | 133.76 | 0.6461 | 665.5 | 677.0 | |
| 0 | 5 | 0 | 3 | -20.05 | 268.81 | -29.71 | 133.32 | 0.6423 | 743.0 | 692.5 | |
| 0 | 4 | 0 | 3 | -21.91 | 267.86 | -30.66 | 134.63 | 0.6672 | 513.0 | 434.1 | |
| 0 | 13 | 0 | 8 | -20.45 | 268.05 | -30.47 | 133.10 | 0.6530 | 447.0 | 460.4 | |
| 0 | 5 | 0 | 3 | -17.14 | 267.95 | -30.57 | 128.90 | 0.6268 | 615.0 | 539.4 | |
| Proj. U | - Projected umbra area in millionths of solar disc, negative values indicate | |
|
that the umbra consists of fragmented regions which cannot be separated without losing umbral area. In this way several spots (intensity minima in the umbra) have a common umbra, e.g. -2 means that the given spot shares an umbra with spot No.2, and the common U value is indicated at spot No.2. |
||
| Proj. WS | - Projected whole spot area in millionths of solar disc, negative values indicate | |
|
that several umbras have a common penumbra, e.g. -7 means that the given umbra shares a penumbra with umbra No.7, and the WS value is indicated at No.7. |
||
| Corr. U | - Corrected umbra area in millionths of solar hemisphere, for negative values see above | |
| Corr. WS | - Corrected whole spot area in millionths of solar hemisphere, for negative values see above | |
| B | - Heliographic latitude B; positive: North, negative: South | |
| L | - Heliographic longitude L | |
| LCM | - Longitudinal distance from the Sun's central meridian | |
| Pos. angle | - Position angle | |
| r | - Distance from the centre of Sun's disc in terms of Sun's radius | |
| MU | - Mean magnetic field within the umbra contour averaged the pixel values with sign. | |
| MP | - Mean magnetic field within the penumbra contour averaged the pixel values with sign. | |