SOHO MDI 2001-09-24 12:47:33 UT
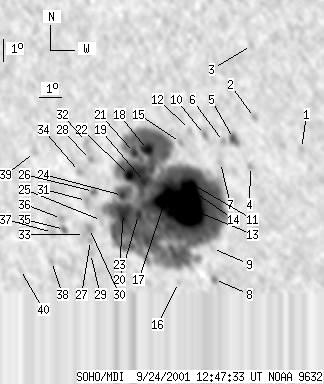
| group | Proj. U | Proj. WS | Corr. U | Corr. WS | B | L | LCM | Pos. angle | r | MU | MP |
| 234 | 1901 | 141 | 1152 | -18.81 | 273.71 | -23.93 | 137.93 | 0.5748 | -823.8 | -120.3 | |
|
previous
or next observation for the same group /
back to the solar disc SOHO MDI 2001-09-24 12:47:33 UT |
| spot | Proj. U | Proj. WS | Corr. U | Corr. WS | B | L | LCM | Pos. angle | r | MU | MP |
| 0 | 5 | 0 | 3 | -16.38 | 280.01 | -17.63 | 143.35 | 0.4888 | 848.0 | 736.2 | |
| 0 | 6 | 0 | 3 | -15.15 | 278.12 | -19.52 | 138.88 | 0.4925 | 497.0 | 442.8 | |
| 0 | 5 | 0 | 3 | -12.15 | 278.25 | -19.39 | 134.64 | 0.4580 | 394.0 | 292.9 | |
| 0 | 5 | 0 | 3 | -17.24 | 277.73 | -19.91 | 141.08 | 0.5199 | 387.0 | 270.8 | |
| 5 | 15 | 3 | 9 | -16.07 | 277.12 | -20.52 | 138.72 | 0.5127 | -901.3 | -677.3 | |
| 0 | 5 | 0 | 3 | -16.22 | 276.67 | -20.97 | 138.31 | 0.5188 | -452.0 | -500.1 | |
| 0 | 6 | 0 | 4 | -17.12 | 276.44 | -21.21 | 139.17 | 0.5309 | -556.0 | -425.2 | |
| 0 | 7 | 0 | 4 | -22.26 | 275.43 | -22.21 | 143.90 | 0.5961 | 446.0 | 414.8 | |
| 0 | 4 | 0 | 2 | -20.89 | 275.56 | -22.08 | 142.56 | 0.5799 | -454.0 | -414.7 | |
| 0 | 8 | 0 | 5 | -15.96 | 275.87 | -21.77 | 136.90 | 0.5240 | -747.0 | -483.2 | |
| 8 | 1699 | 5 | 1026 | -18.13 | 275.07 | -22.57 | 138.69 | 0.5548 | -2454.8 | -169.6 | |
| 0 | 6 | 0 | 4 | -15.78 | 275.24 | -22.41 | 135.84 | 0.5286 | -588.0 | -522.8 | |
| 120 | -11 | 72 | -11 | -19.14 | 274.66 | -22.98 | 139.43 | 0.5693 | -1502.4 | 999999 | |
| 7 | -11 | 4 | -11 | -18.19 | 274.71 | -22.94 | 138.32 | 0.5589 | -1828.2 | 999999 | |
| 0 | 6 | 0 | 3 | -16.35 | 274.77 | -22.87 | 136.03 | 0.5392 | -438.0 | -346.0 | |
| 0 | 4 | 0 | 3 | -22.48 | 273.74 | -23.90 | 142.15 | 0.6125 | -259.0 | -385.5 | |
| 30 | -11 | 18 | -11 | -18.84 | 273.76 | -23.88 | 137.98 | 0.5747 | -1465.7 | 999999 | |
| 10 | -11 | 6 | -11 | -16.73 | 273.26 | -24.39 | 134.70 | 0.5585 | 1650.3 | 999999 | |
| 9 | -11 | 5 | -11 | -18.11 | 272.92 | -24.72 | 136.10 | 0.5755 | -228.1 | 999999 | |
| 5 | -11 | 3 | -11 | -19.56 | 272.42 | -25.22 | 137.33 | 0.5947 | -583.4 | 999999 | |
| 5 | -11 | 3 | -11 | -16.89 | 272.65 | -24.99 | 134.22 | 0.5662 | 1199.6 | 999999 | |
| 7 | -11 | 5 | -11 | -17.89 | 272.28 | -25.36 | 135.09 | 0.5797 | 1589.9 | 999999 | |
| 23 | -11 | 14 | -11 | -19.56 | 271.73 | -25.91 | 136.56 | 0.6012 | 895.5 | 999999 | |
| 5 | -11 | 3 | -11 | -18.77 | 271.82 | -25.83 | 135.70 | 0.5928 | 1026.5 | 999999 | |
| 0 | 11 | 0 | 7 | -19.93 | 270.65 | -27.00 | 135.85 | 0.6150 | 653.0 | 631.8 | |
| 0 | 7 | 0 | 5 | -18.68 | 270.50 | -27.14 | 134.18 | 0.6049 | 312.0 | 373.6 | |
| 0 | 4 | 0 | 3 | -20.84 | 269.95 | -27.69 | 136.23 | 0.6301 | 611.0 | 559.2 | |
| 0 | 5 | 0 | 3 | -17.30 | 270.59 | -27.05 | 132.52 | 0.5914 | 731.0 | 663.2 | |
| 0 | 6 | 0 | 4 | -21.42 | 269.84 | -27.81 | 136.78 | 0.6365 | 763.0 | 660.9 | |
| 0 | 8 | 0 | 5 | -20.31 | 270.01 | -27.63 | 135.66 | 0.6246 | 998.0 | 896.7 | |
| 0 | 9 | 0 | 6 | -19.09 | 270.10 | -27.54 | 134.28 | 0.6126 | 896.0 | 665.1 | |
| 0 | 15 | 0 | 9 | -16.54 | 270.53 | -27.12 | 131.45 | 0.5852 | 776.0 | 523.1 | |
| 0 | 6 | 0 | 4 | -20.59 | 269.72 | -27.92 | 135.70 | 0.6300 | 732.0 | 729.9 | |
| 0 | 7 | 0 | 4 | -17.85 | 269.99 | -27.65 | 132.61 | 0.6024 | 649.0 | 633.1 | |
| 0 | 7 | 0 | 4 | -20.43 | 268.81 | -28.84 | 134.61 | 0.6372 | 736.0 | 680.3 | |
| 0 | 5 | 0 | 3 | -19.95 | 268.76 | -28.88 | 133.99 | 0.6334 | 638.0 | 699.5 | |
| 0 | 11 | 0 | 7 | -20.60 | 268.20 | -29.44 | 134.23 | 0.6445 | 462.0 | 496.3 | |
| 0 | 6 | 0 | 4 | -21.90 | 267.86 | -29.78 | 135.42 | 0.6589 | 493.0 | 475.1 | |
| 0 | 9 | 0 | 6 | -17.16 | 268.02 | -29.63 | 129.79 | 0.6170 | 653.0 | 530.6 | |
| 0 | 4 | 0 | 3 | -22.36 | 266.23 | -31.41 | 134.47 | 0.6777 | 326.0 | 256.9 | |
| Proj. U | - Projected umbra area in millionths of solar disc, negative values indicate | |
|
that the umbra consists of fragmented regions which cannot be separated without losing umbral area. In this way several spots (intensity minima in the umbra) have a common umbra, e.g. -2 means that the given spot shares an umbra with spot No.2, and the common U value is indicated at spot No.2. |
||
| Proj. WS | - Projected whole spot area in millionths of solar disc, negative values indicate | |
|
that several umbras have a common penumbra, e.g. -7 means that the given umbra shares a penumbra with umbra No.7, and the WS value is indicated at No.7. |
||
| Corr. U | - Corrected umbra area in millionths of solar hemisphere, for negative values see above | |
| Corr. WS | - Corrected whole spot area in millionths of solar hemisphere, for negative values see above | |
| B | - Heliographic latitude B; positive: North, negative: South | |
| L | - Heliographic longitude L | |
| LCM | - Longitudinal distance from the Sun's central meridian | |
| Pos. angle | - Position angle | |
| r | - Distance from the centre of Sun's disc in terms of Sun's radius | |
| MU | - Mean magnetic field within the umbra contour averaged the pixel values with sign. | |
| MP | - Mean magnetic field within the penumbra contour averaged the pixel values with sign. | |