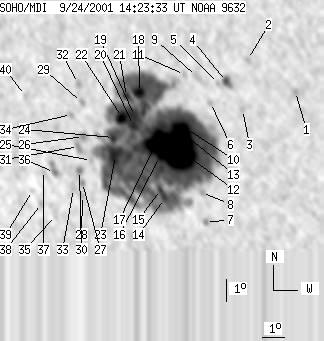
SOHO MDI 2001-09-24 14:23:33 UT
| group | Proj. U | Proj. WS | Corr. U | Corr. WS | B | L | LCM | Pos. angle | r | MU | MP |
| 282 | 1969 | 166 | 1183 | -18.81 | 273.67 | -23.10 | 138.92 | 0.5671 | -700.0 | -113.7 | |
|
previous
or next observation for the same group /
back to the solar disc SOHO MDI 2001-09-24 14:23:33 UT |
| spot | Proj. U | Proj. WS | Corr. U | Corr. WS | B | L | LCM | Pos. angle | r | MU | MP |
| 0 | 5 | 0 | 3 | -16.39 | 280.06 | -16.70 | 144.83 | 0.4806 | 920.0 | 730.4 | |
| 0 | 5 | 0 | 3 | -15.11 | 278.14 | -18.62 | 140.16 | 0.4832 | 560.0 | 438.7 | |
| 0 | 4 | 0 | 2 | -17.25 | 277.71 | -19.05 | 142.31 | 0.5120 | 349.0 | 257.9 | |
| 5 | 15 | 3 | 8 | -16.08 | 277.15 | -19.62 | 140.00 | 0.5039 | -897.8 | -712.1 | |
| 0 | 2 | 0 | 1 | -16.18 | 276.79 | -19.97 | 139.63 | 0.5085 | -650.0 | -538.0 | |
| 0 | 5 | 0 | 3 | -17.01 | 276.35 | -20.41 | 140.09 | 0.5220 | -599.0 | -462.9 | |
| 0 | 5 | 0 | 3 | -22.27 | 275.41 | -21.35 | 144.96 | 0.5891 | 603.0 | 399.1 | |
| 0 | 5 | 0 | 3 | -20.94 | 275.44 | -21.33 | 143.56 | 0.5741 | -460.0 | -392.8 | |
| 0 | 10 | 0 | 6 | -15.93 | 275.87 | -20.90 | 138.01 | 0.5148 | -708.0 | -550.3 | |
| 9 | 1801 | 5 | 1080 | -18.18 | 275.11 | -21.65 | 139.92 | 0.5465 | -2555.6 | -156.7 | |
| 0 | 5 | 0 | 3 | -15.87 | 275.35 | -21.41 | 137.24 | 0.5193 | -622.0 | -510.1 | |
| 117 | -10 | 70 | -10 | -19.14 | 274.72 | -22.05 | 140.58 | 0.5607 | -1486.2 | 999999 | |
| 7 | -10 | 4 | -10 | -18.15 | 274.67 | -22.09 | 139.33 | 0.5504 | -1759.1 | 999999 | |
| 6 | -10 | 4 | -10 | -21.29 | 273.71 | -23.05 | 141.83 | 0.5927 | -733.2 | 999999 | |
| 4 | -10 | 2 | -10 | -20.90 | 273.59 | -23.17 | 141.25 | 0.5895 | -940.1 | 999999 | |
| 6 | -10 | 3 | -10 | -19.45 | 273.78 | -22.99 | 139.79 | 0.5726 | -948.1 | 999999 | |
| 40 | -10 | 24 | -10 | -18.80 | 273.74 | -23.03 | 138.96 | 0.5661 | -1425.3 | 999999 | |
| 10 | -10 | 6 | -10 | -16.73 | 273.27 | -23.50 | 135.76 | 0.5494 | 1657.2 | 999999 | |
| 22 | -10 | 13 | -10 | -17.73 | 272.91 | -23.86 | 136.62 | 0.5631 | 484.1 | 999999 | |
| 9 | -10 | 5 | -10 | -18.16 | 272.80 | -23.96 | 137.04 | 0.5685 | -16.1 | 999999 | |
| 6 | -10 | 3 | -10 | -16.93 | 272.66 | -24.10 | 135.30 | 0.5576 | 1175.9 | 999999 | |
| 14 | -10 | 8 | -10 | -17.84 | 272.35 | -24.41 | 136.12 | 0.5697 | 1694.1 | 999999 | |
| 22 | -10 | 13 | -10 | -19.51 | 271.77 | -24.99 | 137.52 | 0.5919 | 805.2 | 999999 | |
| 5 | -10 | 3 | -10 | -18.73 | 271.81 | -24.95 | 136.61 | 0.5839 | 966.6 | 999999 | |
| 0 | 4 | 0 | 3 | -19.79 | 270.62 | -26.14 | 136.60 | 0.6056 | 949.0 | 755.7 | |
| 0 | 7 | 0 | 4 | -18.77 | 270.43 | -26.33 | 135.14 | 0.5976 | 490.0 | 665.0 | |
| 0 | 6 | 0 | 4 | -20.79 | 270.02 | -26.74 | 137.14 | 0.6207 | 556.0 | 405.4 | |
| 0 | 5 | 0 | 3 | -21.37 | 269.91 | -26.86 | 137.69 | 0.6273 | 798.0 | 720.4 | |
| 0 | 5 | 0 | 3 | -17.30 | 270.58 | -26.19 | 133.43 | 0.5824 | 689.0 | 649.2 | |
| 0 | 8 | 0 | 5 | -20.27 | 269.98 | -26.78 | 136.48 | 0.6162 | 1078.0 | 907.5 | |
| 0 | 12 | 0 | 7 | -19.22 | 270.12 | -26.64 | 135.37 | 0.6049 | 629.0 | 637.5 | |
| 0 | 6 | 0 | 4 | -16.49 | 270.56 | -26.20 | 132.35 | 0.5751 | 721.0 | 567.6 | |
| 0 | 8 | 0 | 5 | -21.08 | 269.54 | -27.22 | 136.98 | 0.6279 | 726.0 | 592.2 | |
| 0 | 4 | 0 | 3 | -17.84 | 270.04 | -26.73 | 133.55 | 0.5930 | 824.0 | 695.9 | |
| 0 | 6 | 0 | 4 | -22.34 | 268.42 | -28.34 | 137.30 | 0.6498 | 474.0 | 437.7 | |
| 0 | 18 | 0 | 11 | -20.43 | 268.78 | -27.99 | 135.44 | 0.6290 | 637.0 | 693.9 | |
| 0 | 8 | 0 | 5 | -20.37 | 268.27 | -28.49 | 134.87 | 0.6334 | 757.0 | 599.3 | |
| 0 | 5 | 0 | 3 | -21.84 | 267.86 | -28.90 | 136.19 | 0.6504 | 599.0 | 532.6 | |
| 0 | 1 | 0 | 1 | -21.29 | 267.55 | -29.21 | 135.26 | 0.6483 | 483.0 | 381.1 | |
| 0 | 4 | 0 | 3 | -17.15 | 268.02 | -28.74 | 130.63 | 0.6076 | 728.0 | 603.9 | |
| Proj. U | - Projected umbra area in millionths of solar disc, negative values indicate | |
|
that the umbra consists of fragmented regions which cannot be separated without losing umbral area. In this way several spots (intensity minima in the umbra) have a common umbra, e.g. -2 means that the given spot shares an umbra with spot No.2, and the common U value is indicated at spot No.2. |
||
| Proj. WS | - Projected whole spot area in millionths of solar disc, negative values indicate | |
|
that several umbras have a common penumbra, e.g. -7 means that the given umbra shares a penumbra with umbra No.7, and the WS value is indicated at No.7. |
||
| Corr. U | - Corrected umbra area in millionths of solar hemisphere, for negative values see above | |
| Corr. WS | - Corrected whole spot area in millionths of solar hemisphere, for negative values see above | |
| B | - Heliographic latitude B; positive: North, negative: South | |
| L | - Heliographic longitude L | |
| LCM | - Longitudinal distance from the Sun's central meridian | |
| Pos. angle | - Position angle | |
| r | - Distance from the centre of Sun's disc in terms of Sun's radius | |
| MU | - Mean magnetic field within the umbra contour averaged the pixel values with sign. | |
| MP | - Mean magnetic field within the penumbra contour averaged the pixel values with sign. | |