SOHO MDI 2001-09-24 20:47:33 UT
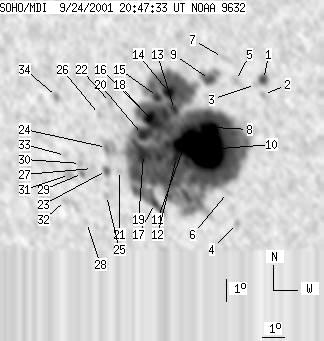
| group | Proj. U | Proj. WS | Corr. U | Corr. WS | B | L | LCM | Pos. angle | r | MU | MP |
| 262 | 1976 | 155 | 1158 | -18.77 | 273.55 | -19.70 | 143.28 | 0.5354 | -671.9 | -134.5 | |
|
previous
or next observation for the same group /
back to the solar disc SOHO MDI 2001-09-24 20:47:33 UT |
| spot | Proj. U | Proj. WS | Corr. U | Corr. WS | B | L | LCM | Pos. angle | r | MU | MP |
| 5 | 16 | 3 | 9 | -16.03 | 277.37 | -15.88 | 145.72 | 0.4688 | -1019.7 | -737.4 | |
| 0 | 4 | 0 | 2 | -16.66 | 277.31 | -15.93 | 146.41 | 0.4773 | -778.0 | -650.5 | |
| 0 | 3 | 0 | 2 | -16.25 | 277.01 | -16.24 | 145.41 | 0.4747 | -446.0 | -416.1 | |
| 0 | 6 | 0 | 4 | -22.34 | 275.58 | -17.67 | 149.88 | 0.5615 | 376.0 | 321.3 | |
| 0 | 9 | 0 | 5 | -16.11 | 276.18 | -17.07 | 143.88 | 0.4804 | -587.0 | -398.5 | |
| 0 | 5 | 0 | 3 | -20.98 | 275.31 | -17.93 | 148.14 | 0.5469 | -311.0 | -313.3 | |
| 0 | 9 | 0 | 5 | -15.16 | 275.71 | -17.54 | 141.89 | 0.4732 | -272.0 | -423.6 | |
| 8 | 1774 | 5 | 1038 | -18.16 | 275.03 | -18.21 | 144.63 | 0.5152 | -2464.8 | -179.4 | |
| 8 | 33 | 4 | 19 | -16.11 | 275.07 | -18.18 | 142.16 | 0.4905 | -228.3 | -248.0 | |
| 117 | -8 | 68 | -8 | -19.13 | 274.62 | -18.63 | 145.15 | 0.5302 | -1547.9 | 999999 | |
| 34 | -8 | 20 | -8 | -18.82 | 273.74 | -19.51 | 143.56 | 0.5342 | -1534.5 | 999999 | |
| 7 | -8 | 4 | -8 | -19.53 | 273.26 | -19.99 | 143.72 | 0.5466 | -783.8 | 999999 | |
| 6 | -8 | 4 | -8 | -17.46 | 273.42 | -19.82 | 141.47 | 0.5214 | -158.7 | 999999 | |
| 11 | -8 | 7 | -8 | -16.74 | 273.28 | -19.96 | 140.36 | 0.5145 | 1692.8 | 999999 | |
| 6 | -8 | 4 | -8 | -16.93 | 272.74 | -20.50 | 139.86 | 0.5219 | 1303.4 | 999999 | |
| 9 | -8 | 6 | -8 | -18.14 | 272.55 | -20.69 | 141.12 | 0.5371 | 329.8 | 999999 | |
| 4 | -8 | 2 | -8 | -21.61 | 271.98 | -21.26 | 144.36 | 0.5808 | 392.7 | 999999 | |
| 12 | -8 | 7 | -8 | -17.85 | 272.28 | -20.96 | 140.40 | 0.5364 | 1731.4 | 999999 | |
| 22 | -8 | 13 | -8 | -19.47 | 271.80 | -21.44 | 141.73 | 0.5586 | 650.3 | 999999 | |
| 10 | -8 | 6 | -8 | -18.60 | 271.88 | -21.37 | 140.79 | 0.5484 | 882.8 | 999999 | |
| 0 | 3 | 0 | 2 | -20.22 | 270.62 | -22.62 | 141.13 | 0.5774 | 889.0 | 771.9 | |
| 0 | 7 | 0 | 4 | -17.29 | 270.64 | -22.61 | 137.56 | 0.5461 | 589.0 | 539.4 | |
| 3 | 11 | 2 | 7 | -20.25 | 270.03 | -23.22 | 140.45 | 0.5830 | 1059.9 | 799.9 | |
| 0 | 28 | 0 | 17 | -19.24 | 270.19 | -23.06 | 139.44 | 0.5710 | 994.0 | 826.3 | |
| 0 | 5 | 0 | 3 | -21.36 | 269.85 | -23.40 | 141.49 | 0.5962 | 834.0 | 702.9 | |
| 0 | 3 | 0 | 2 | -17.83 | 270.08 | -23.17 | 137.56 | 0.5573 | 620.0 | 628.9 | |
| 0 | 4 | 0 | 2 | -20.20 | 269.40 | -23.84 | 139.64 | 0.5881 | 758.0 | 663.1 | |
| 0 | 5 | 0 | 3 | -22.62 | 268.70 | -24.55 | 141.56 | 0.6192 | 405.0 | 307.0 | |
| 0 | 7 | 0 | 4 | -20.44 | 268.91 | -24.34 | 139.36 | 0.5951 | 807.0 | 582.8 | |
| 0 | 4 | 0 | 3 | -20.00 | 268.89 | -24.36 | 138.82 | 0.5908 | 713.0 | 594.9 | |
| 0 | 10 | 0 | 6 | -20.52 | 268.30 | -24.95 | 138.76 | 0.6014 | 707.0 | 580.5 | |
| 0 | 16 | 0 | 10 | -21.68 | 267.90 | -25.34 | 139.65 | 0.6167 | 697.0 | 638.5 | |
| 0 | 7 | 0 | 4 | -19.69 | 268.26 | -24.99 | 137.73 | 0.5936 | 681.0 | 560.7 | |
| 0 | 7 | 0 | 4 | -17.15 | 268.25 | -25.00 | 134.54 | 0.5688 | 777.0 | 634.8 | |
| Proj. U | - Projected umbra area in millionths of solar disc, negative values indicate | |
|
that the umbra consists of fragmented regions which cannot be separated without losing umbral area. In this way several spots (intensity minima in the umbra) have a common umbra, e.g. -2 means that the given spot shares an umbra with spot No.2, and the common U value is indicated at spot No.2. |
||
| Proj. WS | - Projected whole spot area in millionths of solar disc, negative values indicate | |
|
that several umbras have a common penumbra, e.g. -7 means that the given umbra shares a penumbra with umbra No.7, and the WS value is indicated at No.7. |
||
| Corr. U | - Corrected umbra area in millionths of solar hemisphere, for negative values see above | |
| Corr. WS | - Corrected whole spot area in millionths of solar hemisphere, for negative values see above | |
| B | - Heliographic latitude B; positive: North, negative: South | |
| L | - Heliographic longitude L | |
| LCM | - Longitudinal distance from the Sun's central meridian | |
| Pos. angle | - Position angle | |
| r | - Distance from the centre of Sun's disc in terms of Sun's radius | |
| MU | - Mean magnetic field within the umbra contour averaged the pixel values with sign. | |
| MP | - Mean magnetic field within the penumbra contour averaged the pixel values with sign. | |