SOHO MDI 2001-09-24 22:23:33 UT
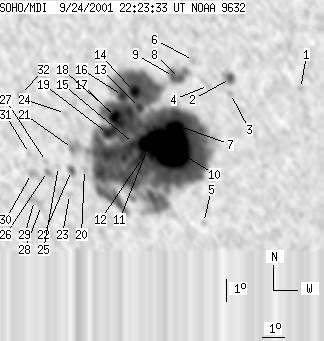
| group | Proj. U | Proj. WS | Corr. U | Corr. WS | B | L | LCM | Pos. angle | r | MU | MP |
| 251 | 1983 | 146 | 1153 | -18.64 | 273.78 | -18.58 | 144.69 | 0.5243 | -813.8 | -121.8 | |
|
previous
or next observation for the same group /
back to the solar disc SOHO MDI 2001-09-24 22:23:33 UT |
| spot | Proj. U | Proj. WS | Corr. U | Corr. WS | B | L | LCM | Pos. angle | r | MU | MP |
| 0 | 5 | 0 | 3 | -16.38 | 280.30 | -12.06 | 152.98 | 0.4432 | 495.0 | 478.6 | |
| 5 | 16 | 3 | 9 | -16.04 | 277.41 | -14.96 | 147.30 | 0.4611 | -1054.1 | -639.4 | |
| 0 | 5 | 0 | 3 | -16.68 | 277.35 | -15.01 | 147.97 | 0.4698 | -734.0 | -596.1 | |
| 0 | 7 | 0 | 4 | -16.37 | 276.45 | -15.91 | 146.08 | 0.4734 | -415.0 | -391.2 | |
| 0 | 4 | 0 | 2 | -22.35 | 275.62 | -16.75 | 151.18 | 0.5551 | 466.0 | 386.2 | |
| 0 | 5 | 0 | 3 | -15.33 | 275.91 | -16.46 | 143.86 | 0.4653 | -707.0 | -569.8 | |
| 10 | 1808 | 6 | 1049 | -18.17 | 275.05 | -17.32 | 145.99 | 0.5077 | -2446.4 | -159.3 | |
| 4 | 39 | 2 | 22 | -16.11 | 275.25 | -17.12 | 143.80 | 0.4808 | -486.7 | -252.4 | |
| 5 | -8 | 3 | -8 | -16.04 | 275.00 | -17.37 | 143.31 | 0.4822 | 343.1 | 999999 | |
| 118 | -7 | 69 | -7 | -19.09 | 274.60 | -17.76 | 146.37 | 0.5226 | -1561.6 | 999999 | |
| 35 | -7 | 20 | -7 | -18.82 | 273.72 | -18.64 | 144.78 | 0.5268 | -1535.3 | 999999 | |
| 8 | -7 | 4 | -7 | -19.58 | 273.28 | -19.08 | 145.02 | 0.5394 | -774.7 | 999999 | |
| 6 | -7 | 3 | -7 | -17.42 | 273.41 | -18.96 | 142.65 | 0.5130 | -239.9 | 999999 | |
| 12 | -7 | 7 | -7 | -16.74 | 273.26 | -19.10 | 141.59 | 0.5065 | 1625.0 | 999999 | |
| 7 | -7 | 4 | -7 | -18.99 | 272.96 | -19.40 | 143.90 | 0.5352 | -690.5 | 999999 | |
| 9 | -7 | 5 | -7 | -16.94 | 272.72 | -19.64 | 141.06 | 0.5138 | 1255.3 | 999999 | |
| 9 | -7 | 5 | -7 | -18.14 | 272.54 | -19.82 | 142.31 | 0.5292 | 459.7 | 999999 | |
| 11 | -7 | 7 | -7 | -17.85 | 272.31 | -20.05 | 141.64 | 0.5280 | 1755.3 | 999999 | |
| 9 | -7 | 6 | -7 | -18.60 | 271.87 | -20.49 | 141.95 | 0.5405 | 916.3 | 999999 | |
| 0 | 3 | 0 | 2 | -20.22 | 270.63 | -21.73 | 142.23 | 0.5695 | 813.0 | 796.5 | |
| 0 | 21 | 0 | 13 | -19.33 | 270.23 | -22.14 | 140.68 | 0.5634 | 1075.0 | 880.3 | |
| 3 | 10 | 2 | 6 | -20.29 | 270.04 | -22.33 | 141.57 | 0.5755 | 1009.4 | 816.6 | |
| 0 | 5 | 0 | 3 | -21.36 | 269.78 | -22.59 | 142.46 | 0.5893 | 703.0 | 602.4 | |
| 0 | 6 | 0 | 3 | -17.83 | 270.12 | -22.24 | 138.71 | 0.5483 | 615.0 | 579.8 | |
| 0 | 3 | 0 | 2 | -20.15 | 269.48 | -22.89 | 140.72 | 0.5789 | 645.0 | 630.5 | |
| 0 | 7 | 0 | 4 | -20.39 | 268.94 | -23.43 | 140.36 | 0.5864 | 708.0 | 628.7 | |
| 0 | 4 | 0 | 3 | -19.96 | 268.96 | -23.40 | 139.88 | 0.5816 | 672.0 | 548.6 | |
| 0 | 7 | 0 | 4 | -21.92 | 268.40 | -23.96 | 141.46 | 0.6070 | 737.0 | 632.1 | |
| 0 | 9 | 0 | 6 | -21.71 | 268.12 | -24.25 | 140.91 | 0.6073 | 639.0 | 699.0 | |
| 0 | 6 | 0 | 4 | -20.52 | 268.19 | -24.18 | 139.63 | 0.5944 | 540.0 | 579.3 | |
| 0 | 4 | 0 | 3 | -19.65 | 268.24 | -24.12 | 138.66 | 0.5850 | 595.0 | 593.9 | |
| 0 | 9 | 0 | 5 | -17.11 | 268.22 | -24.15 | 135.47 | 0.5597 | 565.0 | 616.0 | |
| Proj. U | - Projected umbra area in millionths of solar disc, negative values indicate | |
|
that the umbra consists of fragmented regions which cannot be separated without losing umbral area. In this way several spots (intensity minima in the umbra) have a common umbra, e.g. -2 means that the given spot shares an umbra with spot No.2, and the common U value is indicated at spot No.2. |
||
| Proj. WS | - Projected whole spot area in millionths of solar disc, negative values indicate | |
|
that several umbras have a common penumbra, e.g. -7 means that the given umbra shares a penumbra with umbra No.7, and the WS value is indicated at No.7. |
||
| Corr. U | - Corrected umbra area in millionths of solar hemisphere, for negative values see above | |
| Corr. WS | - Corrected whole spot area in millionths of solar hemisphere, for negative values see above | |
| B | - Heliographic latitude B; positive: North, negative: South | |
| L | - Heliographic longitude L | |
| LCM | - Longitudinal distance from the Sun's central meridian | |
| Pos. angle | - Position angle | |
| r | - Distance from the centre of Sun's disc in terms of Sun's radius | |
| MU | - Mean magnetic field within the umbra contour averaged the pixel values with sign. | |
| MP | - Mean magnetic field within the penumbra contour averaged the pixel values with sign. | |