SOHO MDI 2001-09-24 23:59:33 UT
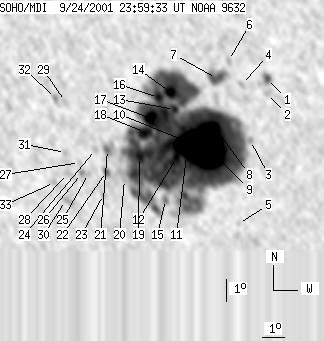
| group | Proj. U | Proj. WS | Corr. U | Corr. WS | B | L | LCM | Pos. angle | r | MU | MP |
| 242 | 1958 | 139 | 1134 | -18.74 | 273.72 | -17.77 | 146.00 | 0.5186 | -812.8 | -140.5 | |
|
previous
or next observation for the same group /
back to the solar disc SOHO MDI 2001-09-24 23:59:33 UT |
| spot | Proj. U | Proj. WS | Corr. U | Corr. WS | B | L | LCM | Pos. angle | r | MU | MP |
| 3 | 11 | 1 | 6 | -16.01 | 277.45 | -14.04 | 148.89 | 0.4532 | -1121.0 | -863.2 | |
| 0 | 7 | 0 | 4 | -16.65 | 277.36 | -14.13 | 149.48 | 0.4623 | -799.0 | -490.5 | |
| 0 | 4 | 0 | 2 | -18.69 | 276.51 | -14.97 | 150.27 | 0.4956 | -828.0 | -795.5 | |
| 0 | 5 | 0 | 3 | -16.30 | 276.34 | -15.15 | 147.29 | 0.4660 | -543.0 | -380.6 | |
| 0 | 3 | 0 | 2 | -22.36 | 275.61 | -15.87 | 152.46 | 0.5492 | 507.0 | 378.4 | |
| 0 | 6 | 0 | 3 | -15.30 | 275.87 | -15.62 | 145.24 | 0.4573 | -749.0 | -595.0 | |
| 8 | 37 | 4 | 21 | -16.08 | 275.30 | -16.18 | 145.27 | 0.4721 | -210.7 | -258.3 | |
| 9 | 1795 | 5 | 1038 | -18.14 | 275.03 | -16.46 | 147.28 | 0.5001 | -2465.2 | -172.3 | |
| 113 | -8 | 65 | -8 | -19.10 | 274.63 | -16.85 | 147.74 | 0.5154 | -1605.7 | 999999 | |
| 33 | -8 | 19 | -8 | -18.83 | 273.75 | -17.73 | 146.12 | 0.5192 | -1604.6 | 999999 | |
| 10 | -8 | 6 | -8 | -19.44 | 273.69 | -17.80 | 146.70 | 0.5271 | -985.7 | 999999 | |
| 7 | -8 | 4 | -8 | -19.55 | 273.24 | -18.25 | 146.17 | 0.5321 | -797.7 | 999999 | |
| 4 | -8 | 2 | -8 | -17.47 | 273.38 | -18.10 | 143.97 | 0.5060 | -308.6 | 999999 | |
| 10 | -8 | 6 | -8 | -16.75 | 273.28 | -18.20 | 142.93 | 0.4983 | 1629.7 | 999999 | |
| 0 | 8 | 0 | 5 | -21.42 | 272.52 | -18.97 | 147.16 | 0.5601 | 253.0 | 388.3 | |
| 7 | -8 | 4 | -8 | -16.99 | 272.74 | -18.74 | 142.42 | 0.5060 | 1314.3 | 999999 | |
| 15 | -8 | 9 | -8 | -17.90 | 272.30 | -19.19 | 142.91 | 0.5207 | 1667.6 | 999999 | |
| 16 | -8 | 10 | -8 | -18.52 | 272.01 | -19.48 | 143.24 | 0.5304 | 748.9 | 999999 | |
| 7 | -8 | 4 | -8 | -19.57 | 271.62 | -19.87 | 143.92 | 0.5460 | 908.1 | 999999 | |
| 0 | 2 | 0 | 1 | -20.61 | 270.81 | -20.67 | 144.02 | 0.5647 | 790.0 | 775.6 | |
| 0 | 15 | 0 | 9 | -19.33 | 270.24 | -21.25 | 141.81 | 0.5554 | 913.0 | 913.0 | |
| 0 | 7 | 0 | 4 | -20.30 | 270.05 | -21.43 | 142.69 | 0.5676 | 1156.0 | 933.0 | |
| 0 | 3 | 0 | 2 | -21.32 | 269.77 | -21.72 | 143.47 | 0.5814 | 694.0 | 630.6 | |
| 0 | 7 | 0 | 4 | -19.36 | 269.70 | -21.79 | 141.15 | 0.5605 | 533.0 | 520.0 | |
| 0 | 2 | 0 | 1 | -20.42 | 269.23 | -22.26 | 141.80 | 0.5763 | 767.0 | 728.8 | |
| 0 | 5 | 0 | 3 | -20.44 | 268.91 | -22.58 | 141.43 | 0.5792 | 641.0 | 613.3 | |
| 0 | 4 | 0 | 2 | -19.96 | 268.90 | -22.59 | 140.86 | 0.5742 | 654.0 | 534.8 | |
| 0 | 7 | 0 | 5 | -20.47 | 268.27 | -23.21 | 140.70 | 0.5852 | 721.0 | 675.8 | |
| 0 | 5 | 0 | 3 | -17.34 | 268.64 | -22.84 | 137.34 | 0.5490 | 516.0 | 498.3 | |
| 0 | 11 | 0 | 7 | -21.67 | 267.98 | -23.51 | 141.71 | 0.6004 | 482.0 | 689.8 | |
| 0 | 3 | 0 | 2 | -19.55 | 268.33 | -23.16 | 139.69 | 0.5751 | 596.0 | 491.5 | |
| 0 | 5 | 0 | 3 | -17.24 | 268.21 | -23.27 | 136.67 | 0.5522 | 692.0 | 569.0 | |
| 0 | 6 | 0 | 4 | -20.90 | 267.61 | -23.87 | 140.41 | 0.5956 | 410.0 | 444.0 | |
| Proj. U | - Projected umbra area in millionths of solar disc, negative values indicate | |
|
that the umbra consists of fragmented regions which cannot be separated without losing umbral area. In this way several spots (intensity minima in the umbra) have a common umbra, e.g. -2 means that the given spot shares an umbra with spot No.2, and the common U value is indicated at spot No.2. |
||
| Proj. WS | - Projected whole spot area in millionths of solar disc, negative values indicate | |
|
that several umbras have a common penumbra, e.g. -7 means that the given umbra shares a penumbra with umbra No.7, and the WS value is indicated at No.7. |
||
| Corr. U | - Corrected umbra area in millionths of solar hemisphere, for negative values see above | |
| Corr. WS | - Corrected whole spot area in millionths of solar hemisphere, for negative values see above | |
| B | - Heliographic latitude B; positive: North, negative: South | |
| L | - Heliographic longitude L | |
| LCM | - Longitudinal distance from the Sun's central meridian | |
| Pos. angle | - Position angle | |
| r | - Distance from the centre of Sun's disc in terms of Sun's radius | |
| MU | - Mean magnetic field within the umbra contour averaged the pixel values with sign. | |
| MP | - Mean magnetic field within the penumbra contour averaged the pixel values with sign. | |