SOHO MDI 2001-09-25 01:35:33 UT
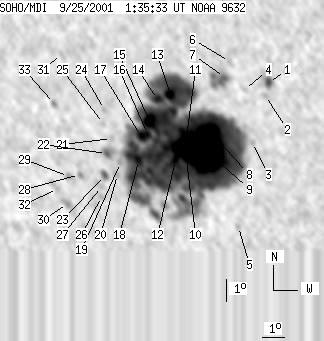
| group | Proj. U | Proj. WS | Corr. U | Corr. WS | B | L | LCM | Pos. angle | r | MU | MP |
| 251 | 1987 | 144 | 1142 | -18.79 | 273.76 | -16.84 | 147.45 | 0.5116 | -946.1 | -109.0 | |
|
previous
or next observation for the same group /
back to the solar disc SOHO MDI 2001-09-25 01:35:33 UT |
| spot | Proj. U | Proj. WS | Corr. U | Corr. WS | B | L | LCM | Pos. angle | r | MU | MP |
| 4 | 15 | 2 | 8 | -16.07 | 277.49 | -13.12 | 150.65 | 0.4468 | -1092.2 | -820.0 | |
| 0 | 4 | 0 | 2 | -16.63 | 277.33 | -13.28 | 150.97 | 0.4555 | -795.0 | -645.6 | |
| 0 | 3 | 0 | 2 | -18.66 | 276.62 | -13.99 | 151.89 | 0.4879 | -692.0 | -710.4 | |
| 0 | 5 | 0 | 3 | -16.40 | 276.46 | -14.14 | 149.16 | 0.4591 | -562.0 | -431.8 | |
| 0 | 5 | 0 | 3 | -22.38 | 275.66 | -14.95 | 153.85 | 0.5433 | 439.0 | 266.0 | |
| 0 | 4 | 0 | 2 | -15.23 | 275.92 | -14.68 | 146.78 | 0.4483 | -691.0 | -558.5 | |
| 0 | 36 | 0 | 20 | -15.92 | 275.66 | -14.94 | 147.17 | 0.4594 | -822.0 | -237.4 | |
| 20 | 1812 | 11 | 1042 | -18.16 | 274.80 | -15.81 | 148.34 | 0.4952 | -2228.9 | -144.1 | |
| 121 | -8 | 70 | -8 | -19.12 | 274.62 | -15.99 | 149.09 | 0.5088 | -1583.6 | 999999 | |
| 8 | -8 | 5 | -8 | -19.45 | 273.72 | -16.88 | 148.07 | 0.5200 | -1046.5 | 999999 | |
| 34 | -8 | 20 | -8 | -18.85 | 273.74 | -16.86 | 147.44 | 0.5122 | -1615.8 | 999999 | |
| 9 | -8 | 5 | -8 | -19.56 | 273.23 | -17.37 | 147.46 | 0.5251 | -831.3 | 999999 | |
| 9 | -8 | 5 | -8 | -16.72 | 273.31 | -17.29 | 144.28 | 0.4897 | 1741.7 | 999999 | |
| 6 | -8 | 3 | -8 | -16.96 | 272.73 | -17.87 | 143.68 | 0.4977 | 1356.7 | 999999 | |
| 14 | -8 | 8 | -8 | -17.87 | 272.30 | -18.31 | 144.14 | 0.5125 | 1650.8 | 999999 | |
| 5 | -8 | 3 | -8 | -18.43 | 272.15 | -18.46 | 144.59 | 0.5205 | 407.6 | 999999 | |
| 10 | -8 | 6 | -8 | -18.58 | 271.87 | -18.74 | 144.36 | 0.5246 | 910.1 | 999999 | |
| 11 | -8 | 6 | -8 | -19.63 | 271.62 | -18.99 | 145.19 | 0.5391 | 800.1 | 999999 | |
| 0 | 4 | 0 | 2 | -19.75 | 270.81 | -19.80 | 144.22 | 0.5473 | 914.0 | 895.9 | |
| 0 | 5 | 0 | 3 | -20.28 | 270.61 | -20.00 | 144.54 | 0.5552 | 945.0 | 804.2 | |
| 0 | 3 | 0 | 2 | -18.72 | 270.55 | -20.06 | 142.67 | 0.5378 | 833.0 | 712.9 | |
| 0 | 18 | 0 | 11 | -19.38 | 270.24 | -20.37 | 143.03 | 0.5481 | 1027.0 | 896.0 | |
| 0 | 9 | 0 | 5 | -20.35 | 270.02 | -20.59 | 143.84 | 0.5609 | 958.0 | 908.8 | |
| 0 | 4 | 0 | 2 | -17.48 | 270.39 | -20.22 | 140.94 | 0.5252 | 707.0 | 645.3 | |
| 0 | 4 | 0 | 3 | -18.08 | 270.27 | -20.33 | 141.53 | 0.5331 | 806.0 | 736.7 | |
| 0 | 4 | 0 | 2 | -21.28 | 269.75 | -20.85 | 144.52 | 0.5738 | 600.0 | 602.2 | |
| 0 | 10 | 0 | 6 | -20.84 | 269.82 | -20.79 | 144.12 | 0.5682 | 289.0 | 482.3 | |
| 0 | 4 | 0 | 2 | -20.36 | 268.91 | -21.70 | 142.42 | 0.5706 | 682.0 | 672.0 | |
| 0 | 6 | 0 | 4 | -20.47 | 268.40 | -22.21 | 141.91 | 0.5763 | 695.0 | 689.3 | |
| 0 | 10 | 0 | 6 | -21.67 | 268.16 | -22.45 | 142.96 | 0.5913 | 788.0 | 695.8 | |
| 0 | 6 | 0 | 3 | -15.18 | 268.78 | -21.83 | 135.73 | 0.5162 | 413.0 | 305.5 | |
| 0 | 10 | 0 | 6 | -21.03 | 267.81 | -22.80 | 141.83 | 0.5874 | 590.0 | 454.8 | |
| 0 | 6 | 0 | 3 | -17.33 | 268.22 | -22.39 | 137.88 | 0.5443 | 787.0 | 604.6 | |
| Proj. U | - Projected umbra area in millionths of solar disc, negative values indicate | |
|
that the umbra consists of fragmented regions which cannot be separated without losing umbral area. In this way several spots (intensity minima in the umbra) have a common umbra, e.g. -2 means that the given spot shares an umbra with spot No.2, and the common U value is indicated at spot No.2. |
||
| Proj. WS | - Projected whole spot area in millionths of solar disc, negative values indicate | |
|
that several umbras have a common penumbra, e.g. -7 means that the given umbra shares a penumbra with umbra No.7, and the WS value is indicated at No.7. |
||
| Corr. U | - Corrected umbra area in millionths of solar hemisphere, for negative values see above | |
| Corr. WS | - Corrected whole spot area in millionths of solar hemisphere, for negative values see above | |
| B | - Heliographic latitude B; positive: North, negative: South | |
| L | - Heliographic longitude L | |
| LCM | - Longitudinal distance from the Sun's central meridian | |
| Pos. angle | - Position angle | |
| r | - Distance from the centre of Sun's disc in terms of Sun's radius | |
| MU | - Mean magnetic field within the umbra contour averaged the pixel values with sign. | |
| MP | - Mean magnetic field within the penumbra contour averaged the pixel values with sign. | |