SOHO MDI 2001-09-25 04:47:33 UT
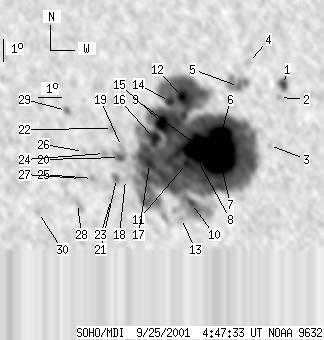
| group | Proj. U | Proj. WS | Corr. U | Corr. WS | B | L | LCM | Pos. angle | r | MU | MP |
| 278 | 1939 | 158 | 1107 | -18.78 | 273.76 | -15.09 | 150.22 | 0.4978 | -972.1 | -112.4 | |
|
previous
or next observation for the same group /
back to the solar disc SOHO MDI 2001-09-25 04:47:33 UT |
| spot | Proj. U | Proj. WS | Corr. U | Corr. WS | B | L | LCM | Pos. angle | r | MU | MP |
| 6 | 16 | 3 | 9 | -16.07 | 277.56 | -11.29 | 154.17 | 0.4334 | -1102.5 | -707.4 | |
| 0 | 4 | 0 | 2 | -16.62 | 277.36 | -11.49 | 154.35 | 0.4426 | -650.0 | -581.2 | |
| 0 | 3 | 0 | 2 | -18.70 | 276.81 | -12.04 | 155.32 | 0.4751 | -784.0 | -597.4 | |
| 0 | 8 | 0 | 5 | -15.18 | 276.17 | -12.68 | 150.44 | 0.4312 | -536.0 | -362.6 | |
| 0 | 34 | 0 | 19 | -16.20 | 275.69 | -13.16 | 150.71 | 0.4488 | -621.0 | -321.5 | |
| 20 | 1783 | 12 | 1016 | -18.19 | 274.82 | -14.03 | 151.33 | 0.4819 | -2342.7 | -143.4 | |
| 128 | -6 | 73 | -6 | -19.11 | 274.62 | -14.23 | 151.92 | 0.4955 | -1653.5 | 999999 | |
| 6 | -6 | 3 | -6 | -19.40 | 273.69 | -15.15 | 150.71 | 0.5060 | -1091.5 | 999999 | |
| 45 | -6 | 26 | -6 | -18.79 | 273.71 | -15.14 | 150.10 | 0.4980 | -1613.1 | 999999 | |
| 4 | -6 | 2 | -6 | -21.34 | 273.24 | -15.61 | 151.90 | 0.5343 | -897.8 | 999999 | |
| 4 | -6 | 2 | -6 | -19.59 | 273.20 | -15.64 | 150.12 | 0.5121 | -915.1 | 999999 | |
| 9 | -6 | 5 | -6 | -16.70 | 273.30 | -15.55 | 147.08 | 0.4744 | 1825.1 | 999999 | |
| 0 | 3 | 0 | 2 | -22.02 | 272.72 | -16.13 | 151.77 | 0.5466 | -22.0 | -16.6 | |
| 6 | -6 | 3 | -6 | -16.94 | 272.73 | -16.12 | 146.42 | 0.4822 | 1289.5 | 999999 | |
| 19 | -6 | 11 | -6 | -17.89 | 272.34 | -16.50 | 146.92 | 0.4973 | 1482.3 | 999999 | |
| 13 | -6 | 7 | -6 | -18.55 | 271.93 | -16.91 | 147.03 | 0.5089 | 702.0 | 999999 | |
| 13 | -6 | 8 | -6 | -19.65 | 271.60 | -17.25 | 147.73 | 0.5251 | 687.5 | 999999 | |
| 0 | 5 | 0 | 3 | -20.39 | 270.47 | -18.38 | 146.89 | 0.5431 | 720.0 | 694.3 | |
| 0 | 5 | 0 | 3 | -18.95 | 270.47 | -18.38 | 145.30 | 0.5260 | 812.0 | 675.2 | |
| 5 | 13 | 3 | 8 | -19.43 | 270.32 | -18.53 | 145.64 | 0.5329 | 992.5 | 858.6 | |
| 0 | 10 | 0 | 6 | -20.36 | 270.08 | -18.77 | 146.31 | 0.5460 | 1191.0 | 886.6 | |
| 0 | 7 | 0 | 4 | -18.19 | 270.16 | -18.69 | 143.97 | 0.5195 | 845.0 | 730.5 | |
| 0 | 3 | 0 | 2 | -21.25 | 269.74 | -19.11 | 146.79 | 0.5592 | 809.0 | 722.3 | |
| 0 | 7 | 0 | 4 | -19.29 | 269.69 | -19.16 | 144.57 | 0.5366 | 825.0 | 632.9 | |
| 0 | 6 | 0 | 3 | -20.41 | 269.01 | -19.83 | 144.90 | 0.5552 | 787.0 | 662.8 | |
| 0 | 5 | 0 | 3 | -19.24 | 268.77 | -20.08 | 143.25 | 0.5439 | 684.0 | 521.0 | |
| 0 | 6 | 0 | 4 | -20.43 | 268.48 | -20.37 | 144.21 | 0.5600 | 963.0 | 819.3 | |
| 0 | 9 | 0 | 5 | -21.54 | 268.18 | -20.66 | 145.04 | 0.5751 | 799.0 | 772.5 | |
| 0 | 6 | 0 | 4 | -17.50 | 268.24 | -20.61 | 140.43 | 0.5291 | 531.0 | 623.3 | |
| 0 | 6 | 0 | 3 | -22.03 | 266.35 | -22.50 | 143.28 | 0.5956 | 554.0 | 526.2 | |
| Proj. U | - Projected umbra area in millionths of solar disc, negative values indicate | |
|
that the umbra consists of fragmented regions which cannot be separated without losing umbral area. In this way several spots (intensity minima in the umbra) have a common umbra, e.g. -2 means that the given spot shares an umbra with spot No.2, and the common U value is indicated at spot No.2. |
||
| Proj. WS | - Projected whole spot area in millionths of solar disc, negative values indicate | |
|
that several umbras have a common penumbra, e.g. -7 means that the given umbra shares a penumbra with umbra No.7, and the WS value is indicated at No.7. |
||
| Corr. U | - Corrected umbra area in millionths of solar hemisphere, for negative values see above | |
| Corr. WS | - Corrected whole spot area in millionths of solar hemisphere, for negative values see above | |
| B | - Heliographic latitude B; positive: North, negative: South | |
| L | - Heliographic longitude L | |
| LCM | - Longitudinal distance from the Sun's central meridian | |
| Pos. angle | - Position angle | |
| r | - Distance from the centre of Sun's disc in terms of Sun's radius | |
| MU | - Mean magnetic field within the umbra contour averaged the pixel values with sign. | |
| MP | - Mean magnetic field within the penumbra contour averaged the pixel values with sign. | |