SOHO MDI 2001-09-25 06:23:33 UT
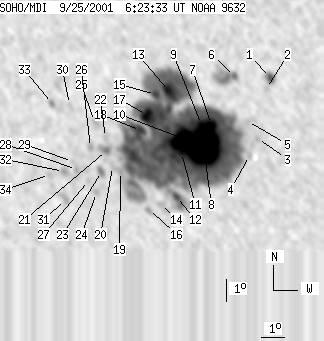
| group | Proj. U | Proj. WS | Corr. U | Corr. WS | B | L | LCM | Pos. angle | r | MU | MP |
| 245 | 1711 | 141 | 973 | -18.77 | 273.86 | -14.11 | 151.83 | 0.4905 | -1110.0 | -131.4 | |
|
previous
or next observation for the same group /
back to the solar disc SOHO MDI 2001-09-25 06:23:33 UT |
| spot | Proj. U | Proj. WS | Corr. U | Corr. WS | B | L | LCM | Pos. angle | r | MU | MP |
| 5 | 15 | 3 | 8 | -16.09 | 277.59 | -10.38 | 156.02 | 0.4277 | -1025.3 | -738.6 | |
| 0 | 4 | 0 | 2 | -16.56 | 277.40 | -10.57 | 156.09 | 0.4356 | -522.0 | -449.0 | |
| 0 | 4 | 0 | 2 | -18.71 | 276.89 | -11.08 | 157.09 | 0.4694 | -598.0 | -473.5 | |
| 0 | 4 | 0 | 3 | -19.46 | 276.50 | -11.46 | 157.03 | 0.4822 | -113.0 | -141.0 | |
| 0 | 3 | 0 | 2 | -17.99 | 276.52 | -11.45 | 155.75 | 0.4615 | -493.0 | -431.1 | |
| 1 | 40 | 1 | 22 | -16.08 | 276.10 | -11.87 | 153.04 | 0.4376 | -840.4 | -322.2 | |
| 11 | 1487 | 6 | 843 | -18.16 | 275.00 | -12.97 | 153.14 | 0.4740 | -2503.9 | -183.4 | |
| 128 | -7 | 73 | -7 | -19.12 | 274.59 | -13.38 | 153.37 | 0.4898 | -1680.4 | 999999 | |
| 7 | -7 | 4 | -7 | -18.17 | 274.58 | -13.39 | 152.41 | 0.4771 | -2066.7 | 999999 | |
| 42 | -7 | 24 | -7 | -18.80 | 273.72 | -14.25 | 151.59 | 0.4916 | -1669.8 | 999999 | |
| 5 | -7 | 3 | -7 | -19.41 | 273.63 | -14.34 | 152.04 | 0.5004 | -1063.3 | 999999 | |
| 6 | 23 | 4 | 13 | -21.36 | 273.22 | -14.75 | 153.24 | 0.5286 | -833.8 | -524.0 | |
| 16 | -7 | 9 | -7 | -16.80 | 273.34 | -14.63 | 148.76 | 0.4682 | 1605.2 | 999999 | |
| 0 | 15 | 0 | 9 | -21.73 | 272.49 | -15.48 | 152.46 | 0.5384 | 110.0 | 10.0 | |
| 5 | -7 | 3 | -7 | -16.95 | 272.74 | -15.23 | 147.91 | 0.4749 | 1276.2 | 999999 | |
| 0 | 6 | 0 | 4 | -21.98 | 271.94 | -16.03 | 151.87 | 0.5453 | 693.0 | 602.1 | |
| 13 | -7 | 7 | -7 | -17.86 | 272.32 | -15.65 | 148.26 | 0.4900 | 1634.7 | 999999 | |
| 6 | -7 | 4 | -7 | -18.52 | 271.96 | -16.01 | 148.41 | 0.5012 | 758.5 | 999999 | |
| 0 | 2 | 0 | 1 | -20.34 | 270.90 | -17.06 | 148.73 | 0.5322 | 762.0 | 821.0 | |
| 0 | 8 | 0 | 5 | -20.13 | 270.58 | -17.39 | 148.04 | 0.5322 | 771.0 | 772.5 | |
| 0 | 16 | 0 | 9 | -19.44 | 270.40 | -17.57 | 147.03 | 0.5252 | 1080.0 | 833.9 | |
| 0 | 8 | 0 | 5 | -18.88 | 270.42 | -17.55 | 146.43 | 0.5181 | 831.0 | 734.6 | |
| 0 | 11 | 0 | 6 | -20.37 | 270.07 | -17.90 | 147.55 | 0.5391 | 1210.0 | 881.5 | |
| 0 | 4 | 0 | 3 | -21.31 | 269.74 | -18.23 | 148.05 | 0.5530 | 683.0 | 647.7 | |
| 0 | 7 | 0 | 4 | -18.20 | 270.02 | -17.95 | 145.06 | 0.5133 | 700.0 | 758.9 | |
| 0 | 6 | 0 | 3 | -19.34 | 269.72 | -18.25 | 145.92 | 0.5295 | 835.0 | 768.5 | |
| 0 | 3 | 0 | 2 | -20.79 | 269.45 | -18.52 | 147.12 | 0.5490 | 625.0 | 632.1 | |
| 0 | 5 | 0 | 3 | -20.33 | 268.98 | -18.99 | 145.97 | 0.5473 | 697.0 | 677.0 | |
| 0 | 2 | 0 | 1 | -19.98 | 268.85 | -19.12 | 145.41 | 0.5443 | 711.0 | 651.0 | |
| 0 | 7 | 0 | 4 | -17.52 | 269.01 | -18.96 | 142.76 | 0.5140 | 827.0 | 631.2 | |
| 0 | 10 | 0 | 6 | -21.68 | 268.31 | -19.65 | 146.50 | 0.5685 | 917.0 | 760.9 | |
| 0 | 8 | 0 | 5 | -20.44 | 268.40 | -19.57 | 145.29 | 0.5534 | 674.0 | 719.5 | |
| 0 | 7 | 0 | 4 | -17.50 | 268.28 | -19.69 | 141.70 | 0.5206 | 708.0 | 567.6 | |
| 0 | 6 | 0 | 4 | -20.60 | 267.75 | -20.21 | 144.60 | 0.5606 | 525.0 | 458.1 | |
| Proj. U | - Projected umbra area in millionths of solar disc, negative values indicate | |
|
that the umbra consists of fragmented regions which cannot be separated without losing umbral area. In this way several spots (intensity minima in the umbra) have a common umbra, e.g. -2 means that the given spot shares an umbra with spot No.2, and the common U value is indicated at spot No.2. |
||
| Proj. WS | - Projected whole spot area in millionths of solar disc, negative values indicate | |
|
that several umbras have a common penumbra, e.g. -7 means that the given umbra shares a penumbra with umbra No.7, and the WS value is indicated at No.7. |
||
| Corr. U | - Corrected umbra area in millionths of solar hemisphere, for negative values see above | |
| Corr. WS | - Corrected whole spot area in millionths of solar hemisphere, for negative values see above | |
| B | - Heliographic latitude B; positive: North, negative: South | |
| L | - Heliographic longitude L | |
| LCM | - Longitudinal distance from the Sun's central meridian | |
| Pos. angle | - Position angle | |
| r | - Distance from the centre of Sun's disc in terms of Sun's radius | |
| MU | - Mean magnetic field within the umbra contour averaged the pixel values with sign. | |
| MP | - Mean magnetic field within the penumbra contour averaged the pixel values with sign. | |