SOHO MDI 2001-09-25 09:49:33 UT
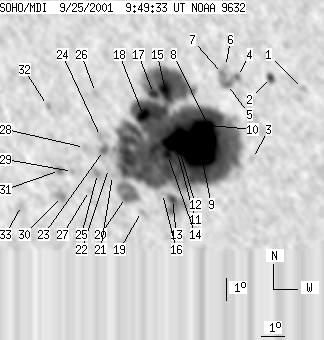
| group | Proj. U | Proj. WS | Corr. U | Corr. WS | B | L | LCM | Pos. angle | r | MU | MP |
| 249 | 1888 | 140 | 1066 | -18.89 | 273.76 | -12.32 | 155.04 | 0.4798 | -1124.1 | -114.3 | |
|
previous
or next observation for the same group /
back to the solar disc SOHO MDI 2001-09-25 09:49:33 UT |
| spot | Proj. U | Proj. WS | Corr. U | Corr. WS | B | L | LCM | Pos. angle | r | MU | MP |
| 0 | 6 | 0 | 3 | -16.54 | 278.97 | -7.11 | 163.37 | 0.4163 | 750.0 | 693.7 | |
| 5 | 10 | 3 | 5 | -16.09 | 277.68 | -8.40 | 160.19 | 0.4160 | -1030.2 | -780.1 | |
| 0 | 5 | 0 | 3 | -19.59 | 276.76 | -9.33 | 161.06 | 0.4722 | -201.0 | -152.4 | |
| 0 | 10 | 0 | 6 | -16.08 | 276.32 | -9.76 | 157.29 | 0.4235 | -749.0 | -745.0 | |
| 0 | 14 | 0 | 8 | -16.43 | 275.89 | -10.19 | 156.73 | 0.4312 | -409.0 | -231.9 | |
| 0 | 2 | 0 | 1 | -15.67 | 275.85 | -10.23 | 155.90 | 0.4205 | -335.0 | -362.8 | |
| 0 | 3 | 0 | 2 | -15.96 | 275.71 | -10.37 | 155.91 | 0.4257 | -83.0 | -103.9 | |
| 10 | 1628 | 6 | 915 | -18.20 | 275.00 | -11.08 | 156.62 | 0.4621 | -2529.1 | -161.2 | |
| 130 | -8 | 73 | -8 | -19.12 | 274.56 | -11.52 | 156.63 | 0.4777 | -1724.9 | 999999 | |
| 7 | -8 | 4 | -8 | -18.17 | 274.59 | -11.50 | 155.82 | 0.4642 | -2176.0 | 999999 | |
| 5 | -8 | 3 | -8 | -19.40 | 273.61 | -12.47 | 155.20 | 0.4875 | -1044.3 | 999999 | |
| 40 | -8 | 23 | -8 | -18.84 | 273.61 | -12.47 | 154.68 | 0.4798 | -1641.1 | 999999 | |
| 5 | 41 | 3 | 24 | -21.48 | 273.22 | -12.86 | 156.35 | 0.5182 | -925.9 | -377.1 | |
| 6 | -8 | 3 | -8 | -19.50 | 273.18 | -12.90 | 154.55 | 0.4917 | -958.4 | 999999 | |
| 17 | -8 | 9 | -8 | -16.75 | 273.30 | -12.78 | 152.02 | 0.4533 | 1701.1 | 999999 | |
| 0 | 8 | 0 | 5 | -21.22 | 272.82 | -13.26 | 155.47 | 0.5172 | -304.0 | -292.7 | |
| 8 | -8 | 4 | -8 | -16.89 | 272.79 | -13.29 | 151.23 | 0.4589 | 1245.7 | 999999 | |
| 16 | -8 | 9 | -8 | -17.84 | 272.30 | -13.78 | 151.38 | 0.4754 | 1644.3 | 999999 | |
| 0 | 5 | 0 | 3 | -22.05 | 271.83 | -14.25 | 154.62 | 0.5344 | 643.0 | 545.1 | |
| 0 | 48 | 0 | 28 | -21.45 | 271.20 | -14.88 | 153.11 | 0.5307 | 168.0 | -87.7 | |
| 0 | 6 | 0 | 3 | -20.50 | 270.74 | -15.34 | 151.50 | 0.5215 | 780.0 | 653.7 | |
| 0 | 1 | 0 | 0 | -20.19 | 270.60 | -15.49 | 150.98 | 0.5186 | 762.0 | 792.3 | |
| 0 | 23 | 0 | 13 | -19.41 | 270.46 | -15.62 | 149.97 | 0.5096 | 1195.0 | 833.6 | |
| 0 | 9 | 0 | 5 | -18.81 | 270.39 | -15.69 | 149.23 | 0.5024 | 973.0 | 840.9 | |
| 0 | 8 | 0 | 5 | -20.43 | 270.10 | -15.98 | 150.44 | 0.5253 | 1088.0 | 904.4 | |
| 0 | 6 | 0 | 3 | -16.93 | 270.35 | -15.73 | 147.04 | 0.4787 | 825.0 | 650.4 | |
| 0 | 6 | 0 | 4 | -21.19 | 269.66 | -16.42 | 150.55 | 0.5381 | 607.0 | 611.0 | |
| 0 | 6 | 0 | 4 | -19.31 | 269.65 | -16.43 | 148.61 | 0.5145 | 449.0 | 533.7 | |
| 0 | 5 | 0 | 3 | -20.38 | 269.02 | -17.06 | 148.78 | 0.5327 | 684.0 | 618.6 | |
| 0 | 17 | 0 | 10 | -21.51 | 268.44 | -17.64 | 149.09 | 0.5509 | 1080.0 | 708.9 | |
| 0 | 8 | 0 | 5 | -20.36 | 268.45 | -17.63 | 147.93 | 0.5368 | 887.0 | 862.2 | |
| 0 | 4 | 0 | 2 | -17.56 | 268.24 | -17.84 | 144.46 | 0.5045 | 536.0 | 550.2 | |
| 0 | 9 | 0 | 6 | -21.98 | 266.57 | -19.52 | 146.99 | 0.5709 | 686.0 | 570.5 | |
| Proj. U | - Projected umbra area in millionths of solar disc, negative values indicate | |
|
that the umbra consists of fragmented regions which cannot be separated without losing umbral area. In this way several spots (intensity minima in the umbra) have a common umbra, e.g. -2 means that the given spot shares an umbra with spot No.2, and the common U value is indicated at spot No.2. |
||
| Proj. WS | - Projected whole spot area in millionths of solar disc, negative values indicate | |
|
that several umbras have a common penumbra, e.g. -7 means that the given umbra shares a penumbra with umbra No.7, and the WS value is indicated at No.7. |
||
| Corr. U | - Corrected umbra area in millionths of solar hemisphere, for negative values see above | |
| Corr. WS | - Corrected whole spot area in millionths of solar hemisphere, for negative values see above | |
| B | - Heliographic latitude B; positive: North, negative: South | |
| L | - Heliographic longitude L | |
| LCM | - Longitudinal distance from the Sun's central meridian | |
| Pos. angle | - Position angle | |
| r | - Distance from the centre of Sun's disc in terms of Sun's radius | |
| MU | - Mean magnetic field within the umbra contour averaged the pixel values with sign. | |
| MP | - Mean magnetic field within the penumbra contour averaged the pixel values with sign. | |