SOHO MDI 2001-09-25 17:59:33 UT
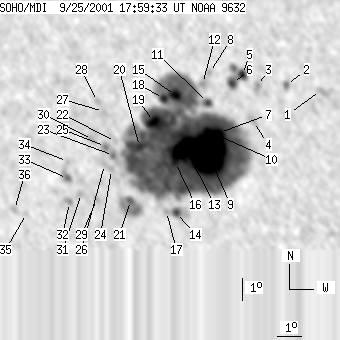
| group | Proj. U | Proj. WS | Corr. U | Corr. WS | B | L | LCM | Pos. angle | r | MU | MP |
| 260 | 1942 | 145 | 1078 | -18.81 | 273.84 | -7.75 | 163.64 | 0.4536 | -1200.6 | -107.9 | |
|
previous
or next observation for the same group /
back to the solar disc SOHO MDI 2001-09-25 17:59:33 UT |
| spot | Proj. U | Proj. WS | Corr. U | Corr. WS | B | L | LCM | Pos. angle | r | MU | MP |
| 0 | 11 | 0 | 6 | -16.37 | 279.21 | -2.38 | 174.24 | 0.3988 | 840.0 | 740.4 | |
| 0 | 7 | 0 | 4 | -16.13 | 277.83 | -3.76 | 170.85 | 0.3978 | -839.0 | -675.1 | |
| 0 | 10 | 0 | 5 | -16.18 | 276.65 | -4.94 | 168.08 | 0.4021 | -714.0 | -569.9 | |
| 0 | 11 | 0 | 6 | -17.72 | 276.45 | -5.14 | 168.40 | 0.4267 | -928.0 | -729.0 | |
| 5 | 47 | 3 | 25 | -15.72 | 276.05 | -5.54 | 166.41 | 0.3970 | -982.3 | -267.8 | |
| 5 | -5 | 3 | -5 | -16.11 | 275.64 | -5.96 | 165.67 | 0.4046 | 439.4 | 999999 | |
| 8 | 1676 | 5 | 929 | -18.21 | 275.03 | -6.56 | 165.63 | 0.4392 | -2526.1 | -149.3 | |
| 0 | 3 | 0 | 2 | -15.66 | 274.71 | -6.88 | 163.24 | 0.4016 | 535.0 | 470.6 | |
| 134 | -7 | 75 | -7 | -19.16 | 274.54 | -7.05 | 165.19 | 0.4556 | -1828.6 | 999999 | |
| 11 | -7 | 6 | -7 | -18.17 | 274.58 | -7.01 | 164.66 | 0.4405 | -2258.6 | 999999 | |
| 4 | -7 | 2 | -7 | -16.93 | 274.59 | -7.01 | 163.86 | 0.4216 | -95.4 | 999999 | |
| 0 | 6 | 0 | 3 | -16.12 | 274.41 | -7.18 | 162.90 | 0.4102 | 695.0 | 535.4 | |
| 42 | -7 | 23 | -7 | -18.88 | 273.59 | -8.00 | 163.12 | 0.4553 | -1740.4 | 999999 | |
| 5 | 22 | 3 | 13 | -21.74 | 273.06 | -8.53 | 163.93 | 0.4996 | -588.0 | -427.1 | |
| 10 | -7 | 5 | -7 | -16.65 | 273.28 | -8.31 | 160.85 | 0.4237 | 1818.6 | 999999 | |
| 6 | -7 | 3 | -7 | -19.54 | 273.14 | -8.45 | 162.69 | 0.4671 | -904.0 | 999999 | |
| 0 | 6 | 0 | 3 | -21.70 | 272.64 | -8.95 | 163.15 | 0.5009 | -341.0 | -320.3 | |
| 5 | -7 | 3 | -7 | -16.79 | 272.78 | -8.81 | 159.90 | 0.4284 | 1163.7 | 999999 | |
| 16 | -7 | 9 | -7 | -17.78 | 272.32 | -9.27 | 159.77 | 0.4454 | 1683.1 | 999999 | |
| 6 | -7 | 3 | -7 | -18.87 | 271.68 | -9.91 | 159.39 | 0.4648 | 523.8 | 999999 | |
| 3 | 51 | 2 | 29 | -21.24 | 271.14 | -10.45 | 160.22 | 0.5015 | -623.6 | -36.4 | |
| 0 | 1 | 0 | 1 | -18.68 | 270.69 | -10.91 | 157.37 | 0.4676 | 809.0 | 652.2 | |
| 0 | 10 | 0 | 6 | -19.29 | 270.56 | -11.03 | 157.66 | 0.4770 | 1101.0 | 878.4 | |
| 0 | 5 | 0 | 3 | -19.90 | 270.43 | -11.16 | 157.94 | 0.4863 | 775.0 | 755.4 | |
| 0 | 7 | 0 | 4 | -18.91 | 270.25 | -11.34 | 156.76 | 0.4734 | 1046.0 | 911.5 | |
| 0 | 2 | 0 | 1 | -19.69 | 270.15 | -11.44 | 157.26 | 0.4850 | 721.0 | 732.1 | |
| 0 | 8 | 0 | 4 | -17.40 | 270.27 | -11.32 | 155.41 | 0.4522 | 719.0 | 718.1 | |
| 0 | 5 | 0 | 3 | -16.98 | 270.04 | -11.55 | 154.57 | 0.4477 | 935.0 | 767.2 | |
| 0 | 6 | 0 | 3 | -21.24 | 269.69 | -11.90 | 157.73 | 0.5092 | 646.0 | 717.6 | |
| 0 | 9 | 0 | 5 | -18.62 | 269.73 | -11.87 | 155.55 | 0.4727 | 831.0 | 724.0 | |
| 0 | 6 | 0 | 3 | -20.99 | 269.07 | -12.52 | 156.49 | 0.5094 | 855.0 | 743.6 | |
| 0 | 8 | 0 | 5 | -21.40 | 268.52 | -13.07 | 155.93 | 0.5183 | 532.0 | 679.1 | |
| 0 | 12 | 0 | 7 | -20.35 | 268.53 | -13.06 | 155.03 | 0.5040 | 883.0 | 817.4 | |
| 0 | 2 | 0 | 1 | -19.60 | 268.60 | -13.00 | 154.46 | 0.4935 | 779.0 | 696.7 | |
| 0 | 4 | 0 | 3 | -21.95 | 266.61 | -14.98 | 153.40 | 0.5377 | 544.0 | 544.2 | |
| 0 | 7 | 0 | 4 | -21.79 | 266.11 | -15.49 | 152.49 | 0.5389 | 716.0 | 584.3 | |
| Proj. U | - Projected umbra area in millionths of solar disc, negative values indicate | |
|
that the umbra consists of fragmented regions which cannot be separated without losing umbral area. In this way several spots (intensity minima in the umbra) have a common umbra, e.g. -2 means that the given spot shares an umbra with spot No.2, and the common U value is indicated at spot No.2. |
||
| Proj. WS | - Projected whole spot area in millionths of solar disc, negative values indicate | |
|
that several umbras have a common penumbra, e.g. -7 means that the given umbra shares a penumbra with umbra No.7, and the WS value is indicated at No.7. |
||
| Corr. U | - Corrected umbra area in millionths of solar hemisphere, for negative values see above | |
| Corr. WS | - Corrected whole spot area in millionths of solar hemisphere, for negative values see above | |
| B | - Heliographic latitude B; positive: North, negative: South | |
| L | - Heliographic longitude L | |
| LCM | - Longitudinal distance from the Sun's central meridian | |
| Pos. angle | - Position angle | |
| r | - Distance from the centre of Sun's disc in terms of Sun's radius | |
| MU | - Mean magnetic field within the umbra contour averaged the pixel values with sign. | |
| MP | - Mean magnetic field within the penumbra contour averaged the pixel values with sign. | |