SOHO MDI 2001-09-25 19:11:33 UT
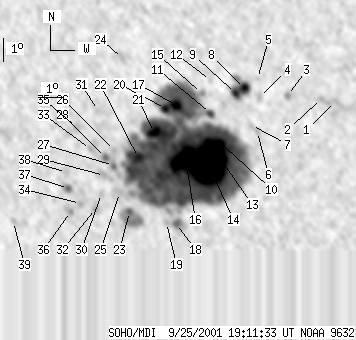
| group | Proj. U | Proj. WS | Corr. U | Corr. WS | B | L | LCM | Pos. angle | r | MU | MP |
| 258 | 1966 | 144 | 1092 | -18.74 | 273.79 | -7.14 | 164.82 | 0.4501 | -1170.5 | -118.4 | |
|
previous
or next observation for the same group /
back to the solar disc SOHO MDI 2001-09-25 19:11:33 UT |
| spot | Proj. U | Proj. WS | Corr. U | Corr. WS | B | L | LCM | Pos. angle | r | MU | MP |
| 0 | 11 | 0 | 6 | -16.40 | 279.78 | -1.15 | 177.22 | 0.3979 | 817.0 | 750.6 | |
| 0 | 11 | 0 | 6 | -16.28 | 279.22 | -1.72 | 175.83 | 0.3964 | 836.0 | 675.4 | |
| 0 | 5 | 0 | 3 | -16.16 | 277.84 | -3.09 | 172.46 | 0.3967 | -922.0 | -669.5 | |
| 0 | 8 | 0 | 5 | -16.25 | 276.70 | -4.23 | 169.78 | 0.4010 | -797.0 | -563.3 | |
| 0 | 2 | 0 | 1 | -15.45 | 276.63 | -4.30 | 169.24 | 0.3885 | -502.0 | -459.5 | |
| 0 | 3 | 0 | 2 | -17.70 | 276.58 | -4.35 | 170.15 | 0.4241 | -1002.0 | -830.3 | |
| 0 | 3 | 0 | 2 | -17.45 | 276.34 | -4.59 | 169.51 | 0.4208 | -790.0 | -709.5 | |
| 8 | 48 | 4 | 26 | -15.88 | 276.10 | -4.83 | 168.17 | 0.3970 | -945.0 | -257.8 | |
| 5 | -8 | 3 | -8 | -16.09 | 275.73 | -5.21 | 167.41 | 0.4016 | 430.7 | 999999 | |
| 10 | 1671 | 6 | 925 | -18.24 | 275.05 | -5.88 | 167.07 | 0.4371 | -2343.3 | -183.0 | |
| 3 | -10 | 2 | -10 | -16.96 | 274.68 | -6.25 | 165.54 | 0.4189 | -181.3 | 999999 | |
| 0 | 2 | 0 | 1 | -15.56 | 274.72 | -6.21 | 164.73 | 0.3971 | 438.0 | 352.2 | |
| 10 | -10 | 6 | -10 | -18.20 | 274.60 | -6.34 | 166.10 | 0.4382 | -2434.7 | 999999 | |
| 125 | -10 | 69 | -10 | -19.15 | 274.52 | -6.41 | 166.47 | 0.4530 | -1841.7 | 999999 | |
| 0 | 6 | 0 | 3 | -16.11 | 274.34 | -6.59 | 164.22 | 0.4073 | 756.0 | 600.2 | |
| 46 | -10 | 26 | -10 | -18.91 | 273.57 | -7.36 | 164.42 | 0.4530 | -1831.2 | 999999 | |
| 12 | -10 | 7 | -10 | -16.64 | 273.30 | -7.63 | 162.28 | 0.4201 | 1827.9 | 999999 | |
| 3 | 20 | 2 | 12 | -21.76 | 273.05 | -7.88 | 165.11 | 0.4974 | -772.2 | -361.7 | |
| 0 | 6 | 0 | 3 | -21.73 | 272.63 | -8.30 | 164.33 | 0.4985 | -295.0 | -176.6 | |
| 4 | -10 | 2 | -10 | -16.77 | 272.84 | -8.09 | 161.40 | 0.4243 | 1356.2 | 999999 | |
| 15 | -10 | 8 | -10 | -17.81 | 272.34 | -8.59 | 161.16 | 0.4423 | 1666.9 | 999999 | |
| 11 | -10 | 6 | -10 | -18.90 | 271.62 | -9.31 | 160.56 | 0.4620 | 425.9 | 999999 | |
| 3 | 48 | 2 | 27 | -21.27 | 271.09 | -9.84 | 161.30 | 0.4988 | -663.6 | -119.2 | |
| 0 | 9 | 0 | 5 | -14.70 | 271.17 | -9.76 | 155.90 | 0.4032 | 1023.0 | 724.8 | |
| 0 | 9 | 0 | 5 | -20.44 | 270.73 | -10.21 | 160.06 | 0.4888 | 917.0 | 721.4 | |
| 0 | 3 | 0 | 2 | -18.62 | 270.63 | -10.30 | 158.45 | 0.4632 | 668.0 | 694.5 | |
| 0 | 15 | 0 | 9 | -19.27 | 270.55 | -10.38 | 158.83 | 0.4730 | 1124.0 | 909.4 | |
| 0 | 7 | 0 | 4 | -18.93 | 270.24 | -10.70 | 157.97 | 0.4699 | 1225.0 | 959.8 | |
| 0 | 17 | 0 | 10 | -19.71 | 270.14 | -10.79 | 158.44 | 0.4816 | 758.0 | 708.8 | |
| 0 | 7 | 0 | 4 | -20.50 | 269.96 | -10.97 | 158.74 | 0.4938 | 766.0 | 471.8 | |
| 0 | 3 | 0 | 2 | -16.92 | 270.07 | -10.86 | 155.84 | 0.4423 | 839.0 | 765.2 | |
| 0 | 5 | 0 | 3 | -21.17 | 269.65 | -11.28 | 158.73 | 0.5048 | 801.0 | 736.5 | |
| 0 | 5 | 0 | 3 | -18.60 | 269.63 | -11.30 | 156.56 | 0.4689 | 846.0 | 778.2 | |
| 0 | 5 | 0 | 3 | -20.97 | 269.03 | -11.90 | 157.51 | 0.5055 | 969.0 | 822.5 | |
| 0 | 7 | 0 | 4 | -17.67 | 269.11 | -11.82 | 154.72 | 0.4591 | 760.0 | 678.7 | |
| 0 | 6 | 0 | 3 | -21.33 | 268.57 | -12.36 | 157.04 | 0.5131 | 782.0 | 674.5 | |
| 3 | 9 | 1 | 5 | -20.32 | 268.57 | -12.36 | 156.19 | 0.4993 | 986.7 | 897.2 | |
| 0 | 10 | 0 | 5 | -19.62 | 268.54 | -12.39 | 155.53 | 0.4899 | 798.0 | 635.9 | |
| 0 | 5 | 0 | 3 | -21.85 | 266.07 | -14.87 | 153.49 | 0.5356 | 603.0 | 637.4 | |
| Proj. U | - Projected umbra area in millionths of solar disc, negative values indicate | |
|
that the umbra consists of fragmented regions which cannot be separated without losing umbral area. In this way several spots (intensity minima in the umbra) have a common umbra, e.g. -2 means that the given spot shares an umbra with spot No.2, and the common U value is indicated at spot No.2. |
||
| Proj. WS | - Projected whole spot area in millionths of solar disc, negative values indicate | |
|
that several umbras have a common penumbra, e.g. -7 means that the given umbra shares a penumbra with umbra No.7, and the WS value is indicated at No.7. |
||
| Corr. U | - Corrected umbra area in millionths of solar hemisphere, for negative values see above | |
| Corr. WS | - Corrected whole spot area in millionths of solar hemisphere, for negative values see above | |
| B | - Heliographic latitude B; positive: North, negative: South | |
| L | - Heliographic longitude L | |
| LCM | - Longitudinal distance from the Sun's central meridian | |
| Pos. angle | - Position angle | |
| r | - Distance from the centre of Sun's disc in terms of Sun's radius | |
| MU | - Mean magnetic field within the umbra contour averaged the pixel values with sign. | |
| MP | - Mean magnetic field within the penumbra contour averaged the pixel values with sign. | |