SOHO MDI 2001-09-25 20:47:33 UT
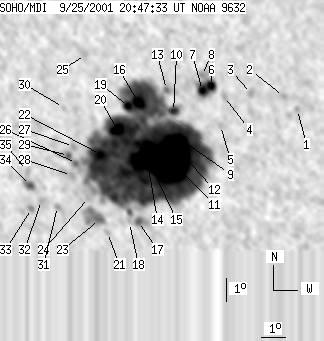
| group | Proj. U | Proj. WS | Corr. U | Corr. WS | B | L | LCM | Pos. angle | r | MU | MP |
| 253 | 1922 | 140 | 1063 | -18.76 | 273.83 | -6.22 | 166.72 | 0.4468 | -1202.0 | -118.8 | |
|
previous
or next observation for the same group /
back to the solar disc SOHO MDI 2001-09-25 20:47:33 UT |
| spot | Proj. U | Proj. WS | Corr. U | Corr. WS | B | L | LCM | Pos. angle | r | MU | MP |
| 0 | 4 | 0 | 2 | -16.88 | 279.76 | -0.30 | 179.30 | 0.4050 | 756.0 | 649.0 | |
| 0 | 5 | 0 | 3 | -16.32 | 279.19 | -0.86 | 177.90 | 0.3964 | 793.0 | 734.4 | |
| 0 | 8 | 0 | 4 | -16.20 | 277.89 | -2.16 | 174.73 | 0.3957 | -743.0 | -594.0 | |
| 0 | 7 | 0 | 4 | -16.34 | 276.79 | -3.26 | 172.12 | 0.3999 | -775.0 | -598.6 | |
| 0 | 3 | 0 | 2 | -17.57 | 276.61 | -3.45 | 172.12 | 0.4198 | -718.0 | -599.0 | |
| 5 | 47 | 3 | 25 | -15.87 | 276.27 | -3.78 | 170.69 | 0.3938 | -1088.6 | -166.3 | |
| 5 | -6 | 3 | -6 | -16.09 | 275.90 | -4.15 | 169.90 | 0.3982 | 655.3 | 999999 | |
| 0 | 12 | 0 | 6 | -15.46 | 275.88 | -4.18 | 169.54 | 0.3882 | -674.0 | -567.0 | |
| 11 | 1657 | 6 | 916 | -18.19 | 274.95 | -5.10 | 168.72 | 0.4338 | -2415.7 | -171.3 | |
| 5 | -9 | 3 | -9 | -16.99 | 274.70 | -5.35 | 167.56 | 0.4161 | -403.3 | 999999 | |
| 130 | -9 | 72 | -9 | -19.14 | 274.55 | -5.50 | 168.33 | 0.4498 | -1824.1 | 999999 | |
| 7 | -9 | 4 | -9 | -18.19 | 274.50 | -5.55 | 167.75 | 0.4353 | -2288.3 | 999999 | |
| 0 | 6 | 0 | 3 | -16.06 | 274.44 | -5.61 | 166.44 | 0.4025 | 631.0 | 539.5 | |
| 4 | -9 | 2 | -9 | -19.42 | 273.59 | -6.47 | 166.51 | 0.4572 | -1171.5 | 999999 | |
| 46 | -9 | 25 | -9 | -18.90 | 273.52 | -6.53 | 166.09 | 0.4495 | -1796.8 | 999999 | |
| 10 | -9 | 5 | -9 | -16.63 | 273.28 | -6.77 | 164.17 | 0.4160 | 1911.6 | 999999 | |
| 0 | 15 | 0 | 9 | -21.80 | 273.06 | -6.99 | 166.73 | 0.4946 | -721.0 | -446.4 | |
| 0 | 2 | 0 | 1 | -21.85 | 272.68 | -7.38 | 166.06 | 0.4967 | -242.0 | -149.8 | |
| 5 | -9 | 3 | -9 | -16.81 | 272.86 | -7.19 | 163.37 | 0.4205 | 1269.3 | 999999 | |
| 12 | -9 | 7 | -9 | -17.80 | 272.37 | -7.68 | 163.02 | 0.4377 | 1693.5 | 999999 | |
| 0 | 5 | 0 | 3 | -22.31 | 271.72 | -8.34 | 164.60 | 0.5071 | 577.0 | 478.3 | |
| 10 | -9 | 6 | -9 | -18.89 | 271.61 | -8.44 | 162.25 | 0.4574 | 561.2 | 999999 | |
| 0 | 43 | 0 | 25 | -21.74 | 271.41 | -8.64 | 163.73 | 0.5001 | -41.0 | -156.9 | |
| 0 | 3 | 0 | 2 | -20.77 | 271.01 | -9.05 | 162.39 | 0.4879 | 647.0 | 546.0 | |
| 0 | 11 | 0 | 6 | -14.64 | 271.19 | -8.86 | 157.84 | 0.3967 | 889.0 | 768.7 | |
| 0 | 11 | 0 | 6 | -19.30 | 270.59 | -9.46 | 160.57 | 0.4685 | 1069.0 | 949.2 | |
| 0 | 7 | 0 | 4 | -18.56 | 270.51 | -9.55 | 159.85 | 0.4583 | 869.0 | 734.9 | |
| 0 | 20 | 0 | 11 | -19.83 | 270.35 | -9.70 | 160.52 | 0.4773 | 894.0 | 725.3 | |
| 0 | 15 | 0 | 8 | -18.96 | 270.28 | -9.78 | 159.72 | 0.4652 | 946.0 | 798.3 | |
| 0 | 3 | 0 | 2 | -16.90 | 270.18 | -9.87 | 157.80 | 0.4359 | 642.0 | 695.1 | |
| 0 | 6 | 0 | 3 | -21.20 | 269.67 | -10.39 | 160.29 | 0.5005 | 778.0 | 664.5 | |
| 0 | 6 | 0 | 3 | -20.95 | 269.00 | -11.05 | 158.96 | 0.5004 | 919.0 | 817.3 | |
| 0 | 4 | 0 | 2 | -21.32 | 268.55 | -11.50 | 158.46 | 0.5080 | 800.0 | 666.1 | |
| 3 | 15 | 1 | 9 | -20.30 | 268.59 | -11.47 | 157.72 | 0.4937 | 1001.9 | 789.1 | |
| 0 | 7 | 0 | 4 | -19.65 | 268.51 | -11.54 | 157.03 | 0.4850 | 715.0 | 667.0 | |
| Proj. U | - Projected umbra area in millionths of solar disc, negative values indicate | |
|
that the umbra consists of fragmented regions which cannot be separated without losing umbral area. In this way several spots (intensity minima in the umbra) have a common umbra, e.g. -2 means that the given spot shares an umbra with spot No.2, and the common U value is indicated at spot No.2. |
||
| Proj. WS | - Projected whole spot area in millionths of solar disc, negative values indicate | |
|
that several umbras have a common penumbra, e.g. -7 means that the given umbra shares a penumbra with umbra No.7, and the WS value is indicated at No.7. |
||
| Corr. U | - Corrected umbra area in millionths of solar hemisphere, for negative values see above | |
| Corr. WS | - Corrected whole spot area in millionths of solar hemisphere, for negative values see above | |
| B | - Heliographic latitude B; positive: North, negative: South | |
| L | - Heliographic longitude L | |
| LCM | - Longitudinal distance from the Sun's central meridian | |
| Pos. angle | - Position angle | |
| r | - Distance from the centre of Sun's disc in terms of Sun's radius | |
| MU | - Mean magnetic field within the umbra contour averaged the pixel values with sign. | |
| MP | - Mean magnetic field within the penumbra contour averaged the pixel values with sign. | |