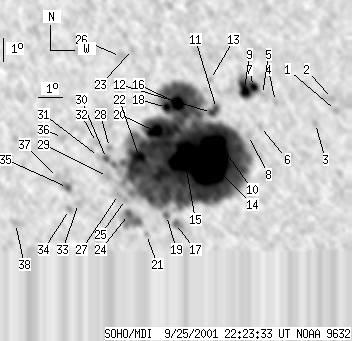
SOHO MDI 2001-09-25 22:23:33 UT
| group | Proj. U | Proj. WS | Corr. U | Corr. WS | B | L | LCM | Pos. angle | r | MU | MP |
| 262 | 1943 | 145 | 1072 | -18.78 | 273.80 | -5.37 | 168.50 | 0.4443 | -1152.8 | -118.0 | |
|
previous
or next observation for the same group /
back to the solar disc SOHO MDI 2001-09-25 22:23:33 UT |
| spot | Proj. U | Proj. WS | Corr. U | Corr. WS | B | L | LCM | Pos. angle | r | MU | MP |
| 0 | 4 | 0 | 2 | -16.88 | 279.73 | 0.56 | 181.33 | 0.4050 | 803.0 | 669.9 | |
| 0 | 5 | 0 | 3 | -16.37 | 279.61 | 0.44 | 181.06 | 0.3968 | 845.0 | 781.3 | |
| 0 | 6 | 0 | 3 | -17.43 | 278.92 | -0.25 | 179.41 | 0.4138 | 420.0 | 445.7 | |
| 0 | 5 | 0 | 2 | -16.50 | 277.30 | -1.88 | 175.48 | 0.4000 | -682.0 | -623.4 | |
| 0 | 1 | 0 | 0 | -16.20 | 276.77 | -2.40 | 174.14 | 0.3961 | -558.0 | -465.7 | |
| 0 | 5 | 0 | 3 | -17.57 | 276.67 | -2.50 | 174.26 | 0.4179 | -759.0 | -543.7 | |
| 5 | 54 | 3 | 29 | -15.87 | 276.41 | -2.76 | 173.17 | 0.3913 | -1114.9 | -323.4 | |
| 0 | 5 | 0 | 3 | -17.95 | 276.17 | -3.00 | 173.25 | 0.4249 | -510.0 | -503.0 | |
| 14 | -7 | 8 | -7 | -15.99 | 276.04 | -3.13 | 172.31 | 0.3941 | 576.1 | 999999 | |
| 7 | 1673 | 4 | 924 | -18.22 | 274.94 | -4.24 | 170.61 | 0.4318 | -2470.4 | -160.9 | |
| 2 | 15 | 1 | 8 | -16.81 | 274.89 | -4.28 | 169.91 | 0.4099 | -664.8 | -354.8 | |
| 4 | -11 | 2 | -11 | -16.98 | 274.68 | -4.49 | 169.51 | 0.4132 | -332.6 | 999999 | |
| 0 | 4 | 0 | 2 | -15.58 | 274.67 | -4.50 | 168.81 | 0.3912 | 554.0 | 512.6 | |
| 144 | -10 | 80 | -10 | -19.05 | 274.54 | -4.63 | 170.10 | 0.4457 | -1877.3 | 999999 | |
| 45 | -10 | 25 | -10 | -18.97 | 273.51 | -5.66 | 167.92 | 0.4476 | -1771.6 | 999999 | |
| 9 | -10 | 5 | -10 | -16.62 | 273.30 | -5.87 | 166.18 | 0.4121 | 1952.0 | 999999 | |
| 0 | 11 | 0 | 6 | -21.83 | 273.03 | -6.15 | 168.30 | 0.4922 | -757.0 | -479.4 | |
| 4 | -10 | 2 | -10 | -16.79 | 272.85 | -6.33 | 165.27 | 0.4166 | 1326.1 | 999999 | |
| 0 | 8 | 0 | 5 | -21.48 | 272.66 | -6.51 | 167.47 | 0.4882 | -351.0 | -263.4 | |
| 15 | -10 | 8 | -10 | -17.82 | 272.36 | -6.81 | 164.86 | 0.4343 | 1640.6 | 999999 | |
| 0 | 3 | 0 | 2 | -22.34 | 271.77 | -7.40 | 166.27 | 0.5039 | 533.0 | 447.9 | |
| 13 | -10 | 7 | -10 | -18.96 | 271.65 | -7.52 | 164.11 | 0.4543 | 468.3 | 999999 | |
| 0 | 5 | 0 | 3 | -14.37 | 271.55 | -7.63 | 160.43 | 0.3855 | 637.0 | 630.2 | |
| 0 | 43 | 0 | 24 | -21.46 | 271.06 | -8.11 | 164.51 | 0.4938 | -779.0 | -173.0 | |
| 0 | 5 | 0 | 3 | -20.80 | 270.97 | -8.20 | 163.95 | 0.4845 | 594.0 | 509.0 | |
| 0 | 14 | 0 | 8 | -14.67 | 271.05 | -8.13 | 159.54 | 0.3928 | 821.0 | 702.3 | |
| 0 | 4 | 0 | 2 | -20.59 | 270.69 | -8.49 | 163.30 | 0.4826 | 845.0 | 829.9 | |
| 0 | 4 | 0 | 2 | -18.55 | 270.42 | -8.75 | 161.39 | 0.4539 | 825.0 | 731.6 | |
| 0 | 6 | 0 | 3 | -19.81 | 270.27 | -8.90 | 162.00 | 0.4731 | 933.0 | 796.2 | |
| 0 | 7 | 0 | 4 | -19.02 | 270.27 | -8.90 | 161.45 | 0.4617 | 1062.0 | 843.1 | |
| 0 | 1 | 0 | 1 | -18.94 | 269.94 | -9.23 | 160.75 | 0.4621 | 796.0 | 796.0 | |
| 0 | 6 | 0 | 3 | -18.34 | 269.89 | -9.28 | 160.19 | 0.4536 | 884.0 | 664.0 | |
| 0 | 10 | 0 | 6 | -21.02 | 268.97 | -10.20 | 160.49 | 0.4969 | 857.0 | 769.5 | |
| 0 | 6 | 0 | 3 | -21.29 | 268.57 | -10.60 | 159.98 | 0.5029 | 893.0 | 713.6 | |
| 0 | 11 | 0 | 6 | -20.33 | 268.55 | -10.62 | 159.23 | 0.4893 | 1140.0 | 867.0 | |
| 0 | 10 | 0 | 5 | -18.16 | 268.49 | -10.69 | 157.32 | 0.4588 | 655.0 | 635.7 | |
| 0 | 5 | 0 | 3 | -19.90 | 268.16 | -11.01 | 158.19 | 0.4854 | 762.0 | 681.4 | |
| 0 | 7 | 0 | 4 | -21.98 | 266.20 | -12.97 | 156.56 | 0.5254 | 636.0 | 602.5 | |
| Proj. U | - Projected umbra area in millionths of solar disc, negative values indicate | |
|
that the umbra consists of fragmented regions which cannot be separated without losing umbral area. In this way several spots (intensity minima in the umbra) have a common umbra, e.g. -2 means that the given spot shares an umbra with spot No.2, and the common U value is indicated at spot No.2. |
||
| Proj. WS | - Projected whole spot area in millionths of solar disc, negative values indicate | |
|
that several umbras have a common penumbra, e.g. -7 means that the given umbra shares a penumbra with umbra No.7, and the WS value is indicated at No.7. |
||
| Corr. U | - Corrected umbra area in millionths of solar hemisphere, for negative values see above | |
| Corr. WS | - Corrected whole spot area in millionths of solar hemisphere, for negative values see above | |
| B | - Heliographic latitude B; positive: North, negative: South | |
| L | - Heliographic longitude L | |
| LCM | - Longitudinal distance from the Sun's central meridian | |
| Pos. angle | - Position angle | |
| r | - Distance from the centre of Sun's disc in terms of Sun's radius | |
| MU | - Mean magnetic field within the umbra contour averaged the pixel values with sign. | |
| MP | - Mean magnetic field within the penumbra contour averaged the pixel values with sign. | |